
AI / FINTECH / CRYPTO / TECH

NY Presswire

Understand the systems shaping money.

Stories: Federal Reserve
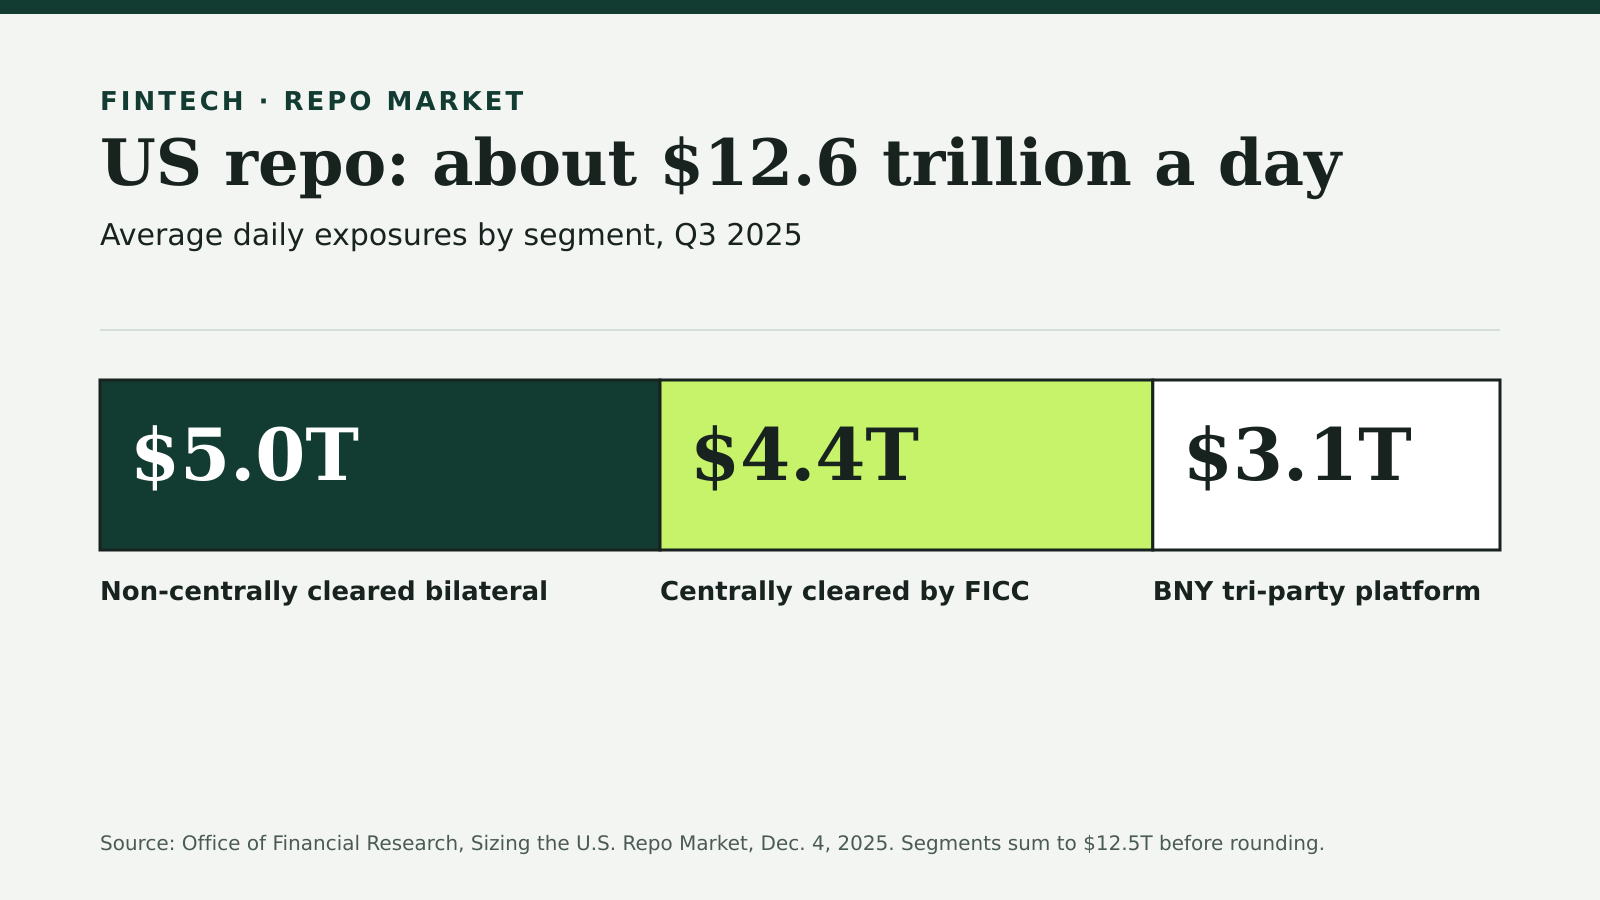
Bar split into three segments of the US repo market in Q3 2025: $5.0 trillion non-centrally cleared bilateral, $4.4 trillion centrally cleared by FICC and $3.1 trillion on BNY's tri-party platform, about $12.6 trillion in total.
Repo ·

Tri-Party Repo Explained: How It Differs From Bilateral Repo

How tri-party, GCF, DVP and non-cleared bilateral repo differ, and what TGCR, BGCR and SOFR show about each segment.
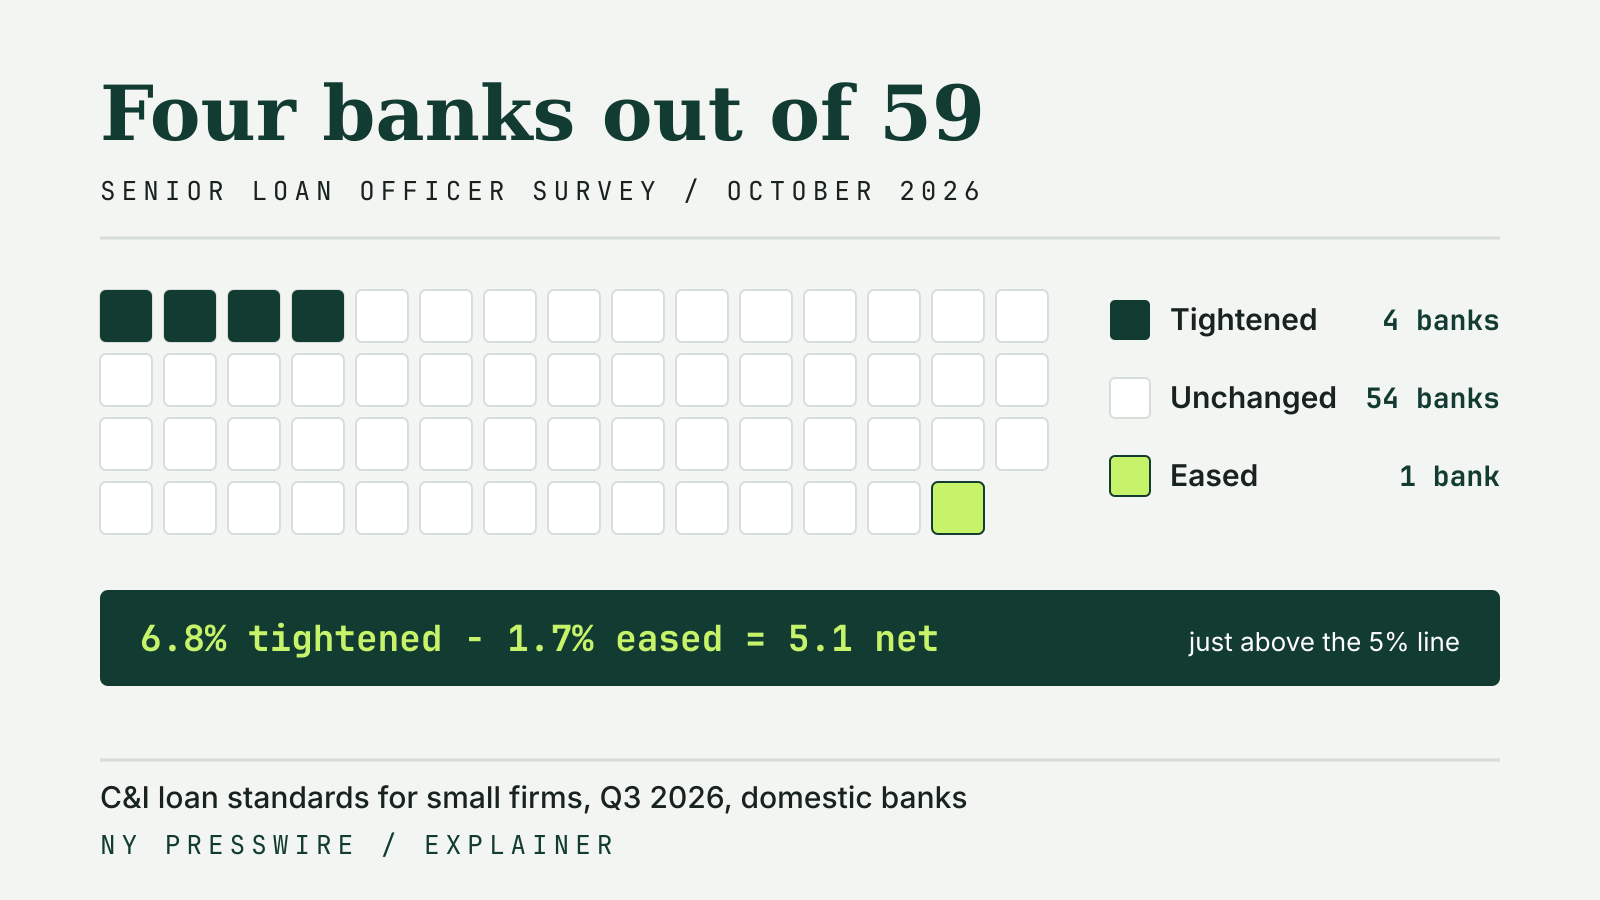
Grid of 59 squares, one per bank: 4 tightened, 54 unchanged and 1 eased C&I loan standards for small firms in the October 2026 Senior Loan Officer Opinion Survey, a net 5.1 percent.
Federal Reserve ·

Senior Loan Officer Opinion Survey: How to Read It

How the Fed's SLOOS turns bank answers into net percentages, worked through the October 2026 survey.
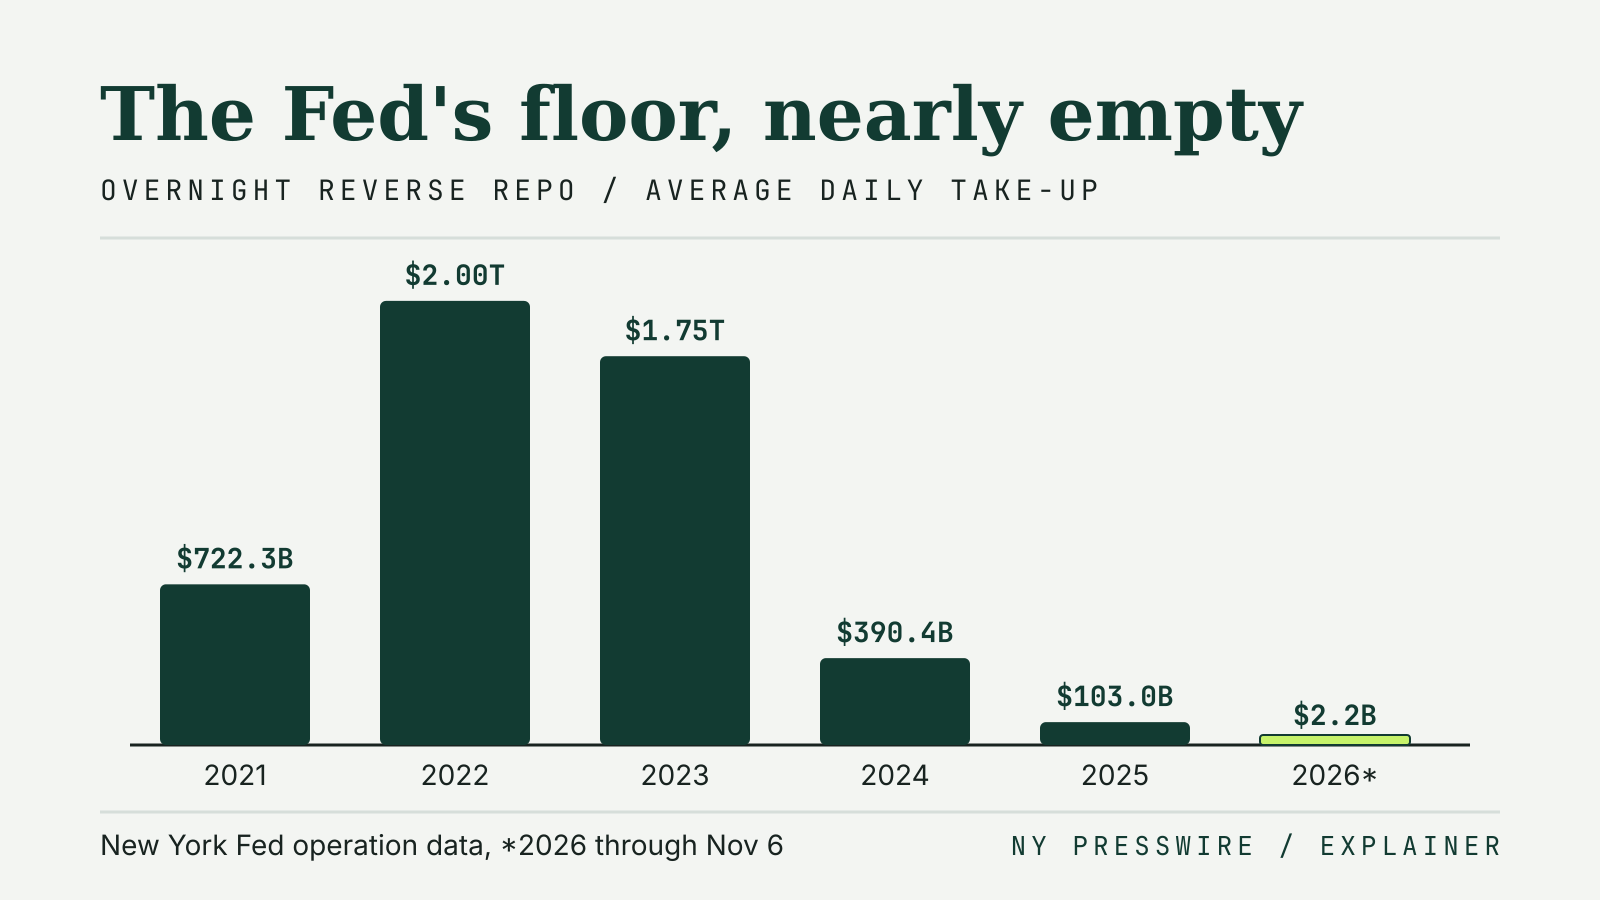
Bar chart of average daily take-up at the Fed's overnight reverse repo facility: $722.3 billion in 2021, $2.00 trillion in 2022, $1.75 trillion in 2023, $390.4 billion in 2024, $103.0 billion in 2025 and $2.2 billion in 2026 through November 6.
Federal Reserve ·

Overnight Reverse Repo Facility: Why the Fed's Floor Sits Empty

How the Fed's ON RRP sets a floor at 3.75%, and why take-up fell from $2.55T in 2022 to $150M on Nov 6, 2026.
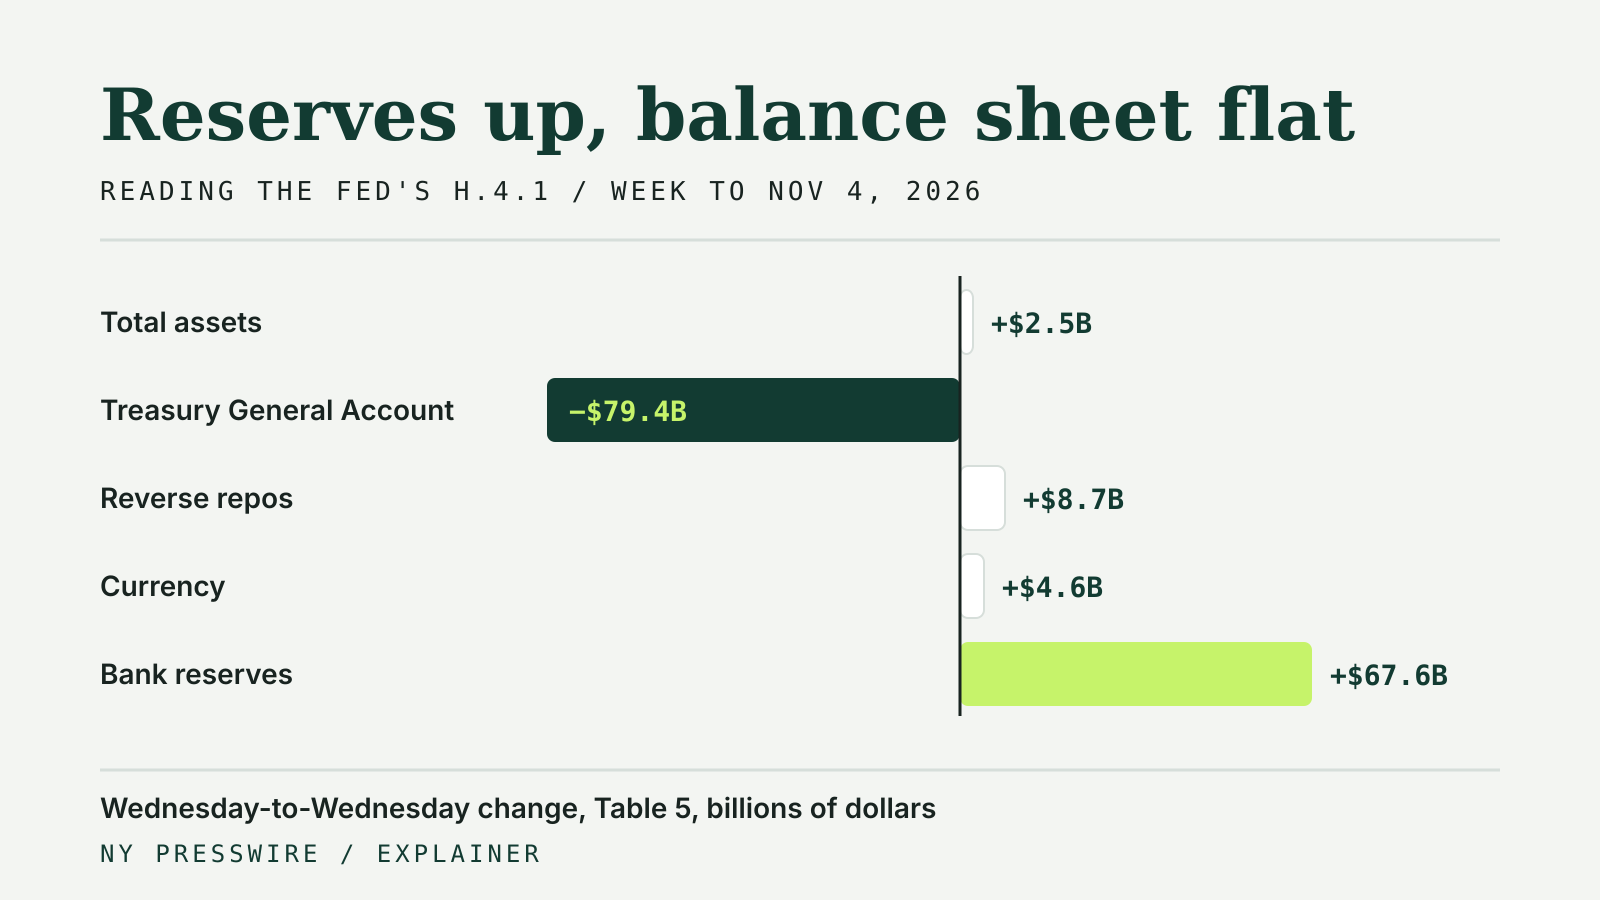
Bar chart of H.4.1 Table 5 changes from October 28 to November 4, 2026: total assets up $2.5 billion, Treasury General Account down $79.4 billion, reverse repos up $8.7 billion, currency up $4.6 billion and bank reserves up $67.6 billion
Federal Reserve ·

How to Read the Fed's H.4.1 Balance Sheet Release

Which H.4.1 table answers which question, worked through Nov 5, 2026: reserves up $67.6B as the TGA fell.
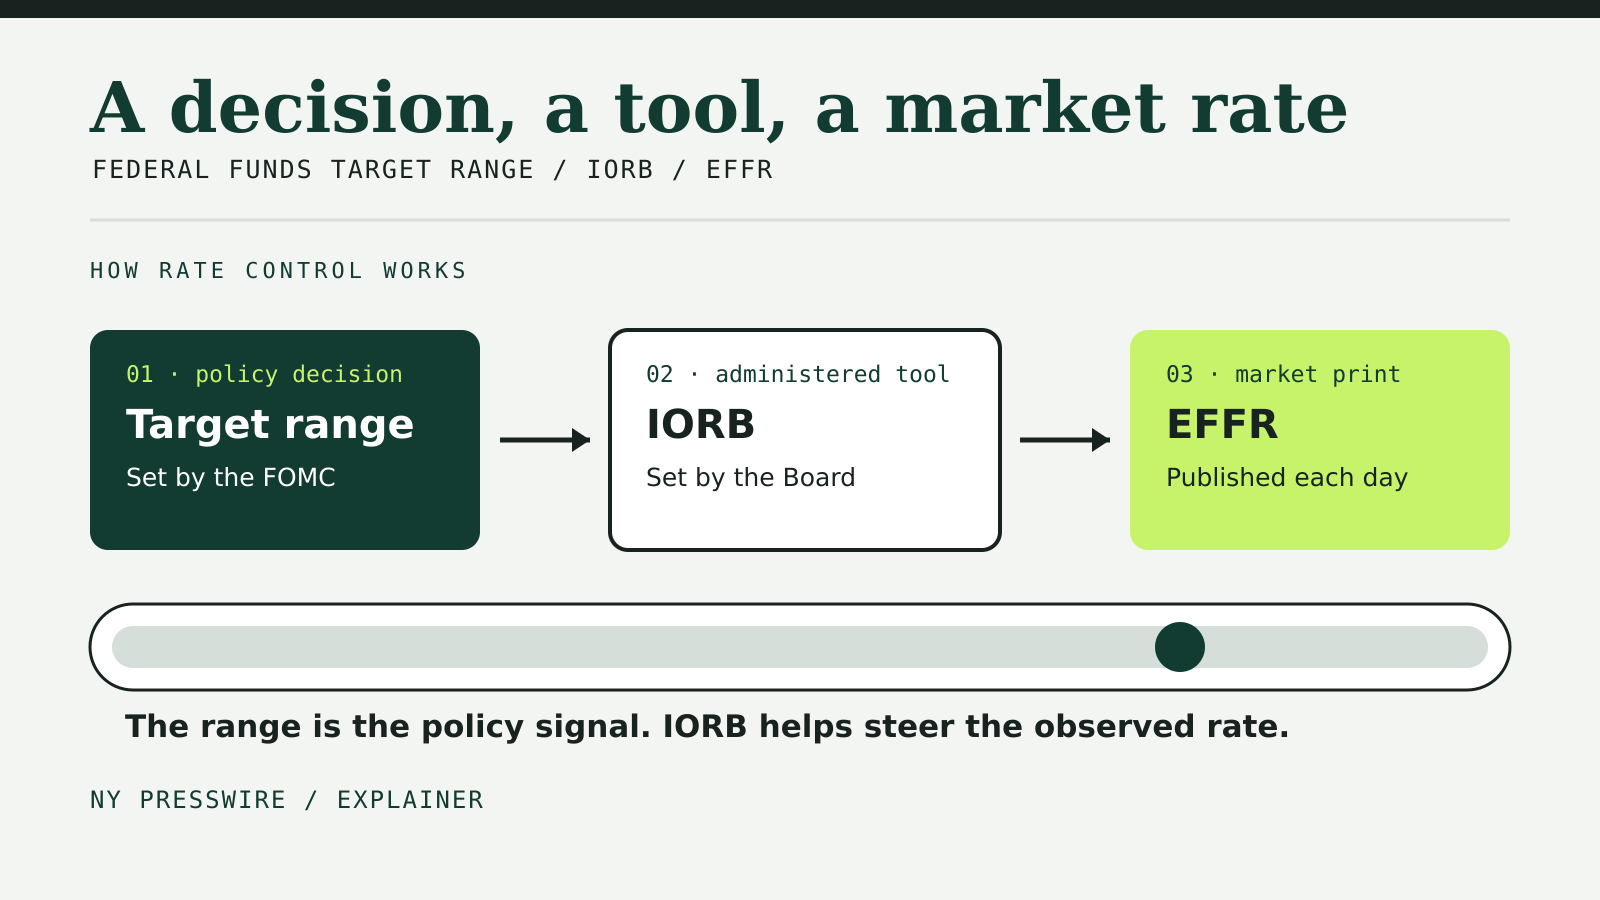
Diagram showing the relationship between the FOMC target range, the Federal Reserve's IORB tool and the daily effective federal funds rate, with a market-rate band below.
Federal funds rate ·

Federal Funds Target Range vs Effective Rate

The target range is the Fed's policy signal, IORB is an implementation tool and EFFR is the observed market rate.
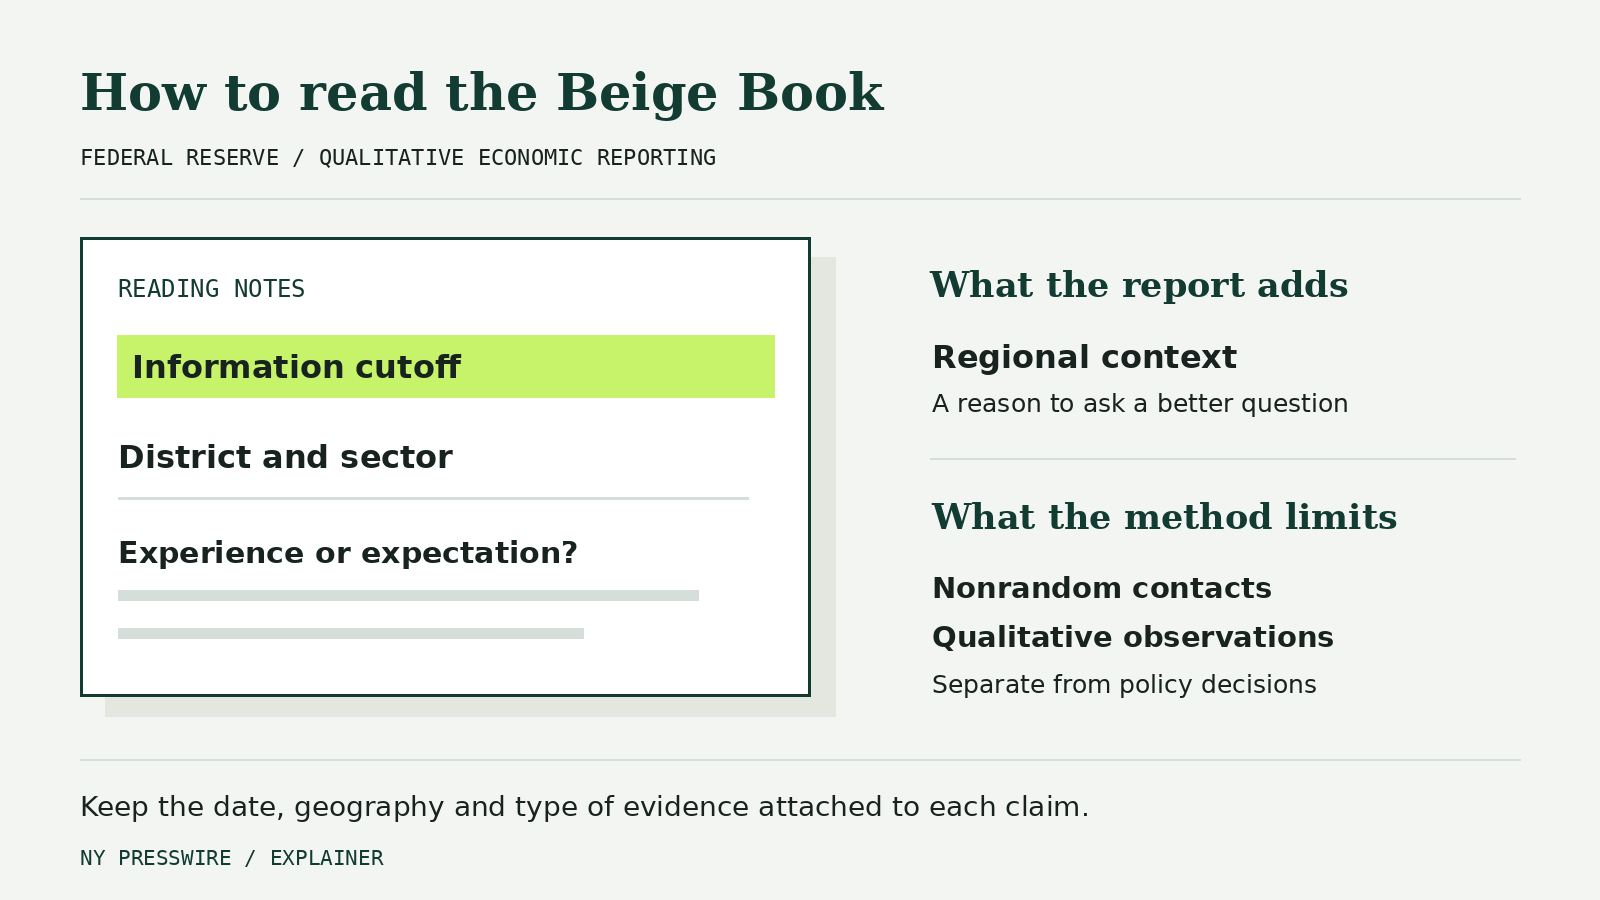
Reading-note sheet highlighting the information cutoff, District and sector, and experience versus expectation, beside the report's regional context and nonrandom qualitative method.
Federal Reserve ·

What Is the Fed Beige Book? How to Read Its Evidence

Read the Beige Book as regional evidence with dates, context and clear limits.
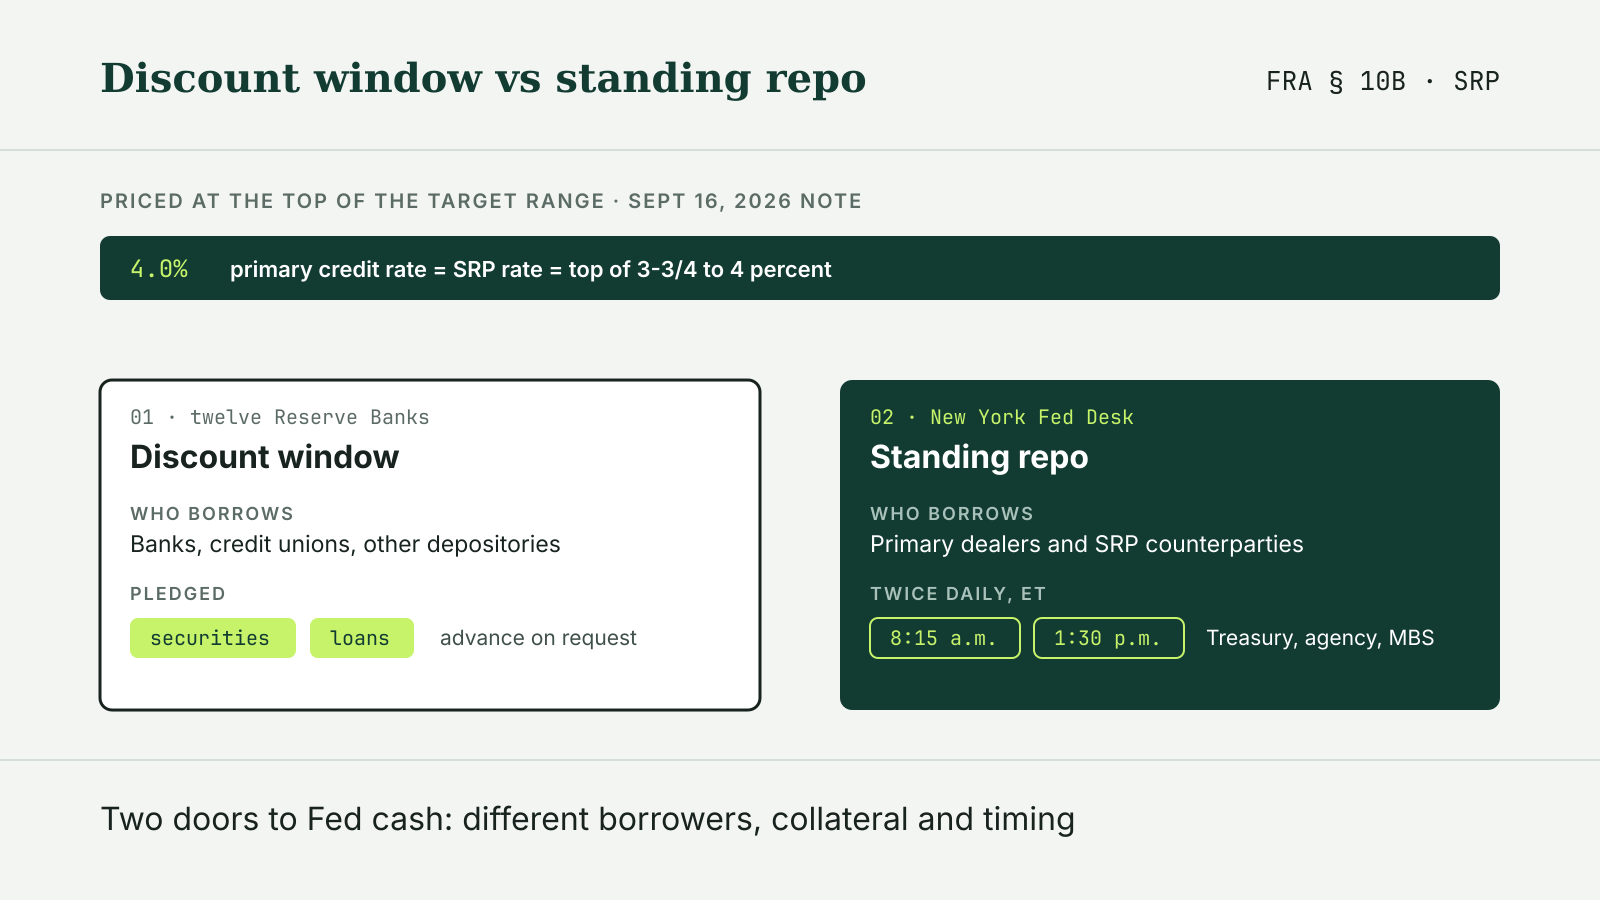
Comparison of the Federal Reserve discount window and standing repo operations: who borrows, what collateral is pledged and the two daily operation times, under a band showing both rates at 4.0 percent in the September 16, 2026 implementation note
Federal Reserve ·

Discount Window vs Standing Repo Facility: The Fed's Two Backstops

Who can borrow, what they pledge and how each is priced: the Fed's discount window and standing repo side by side.
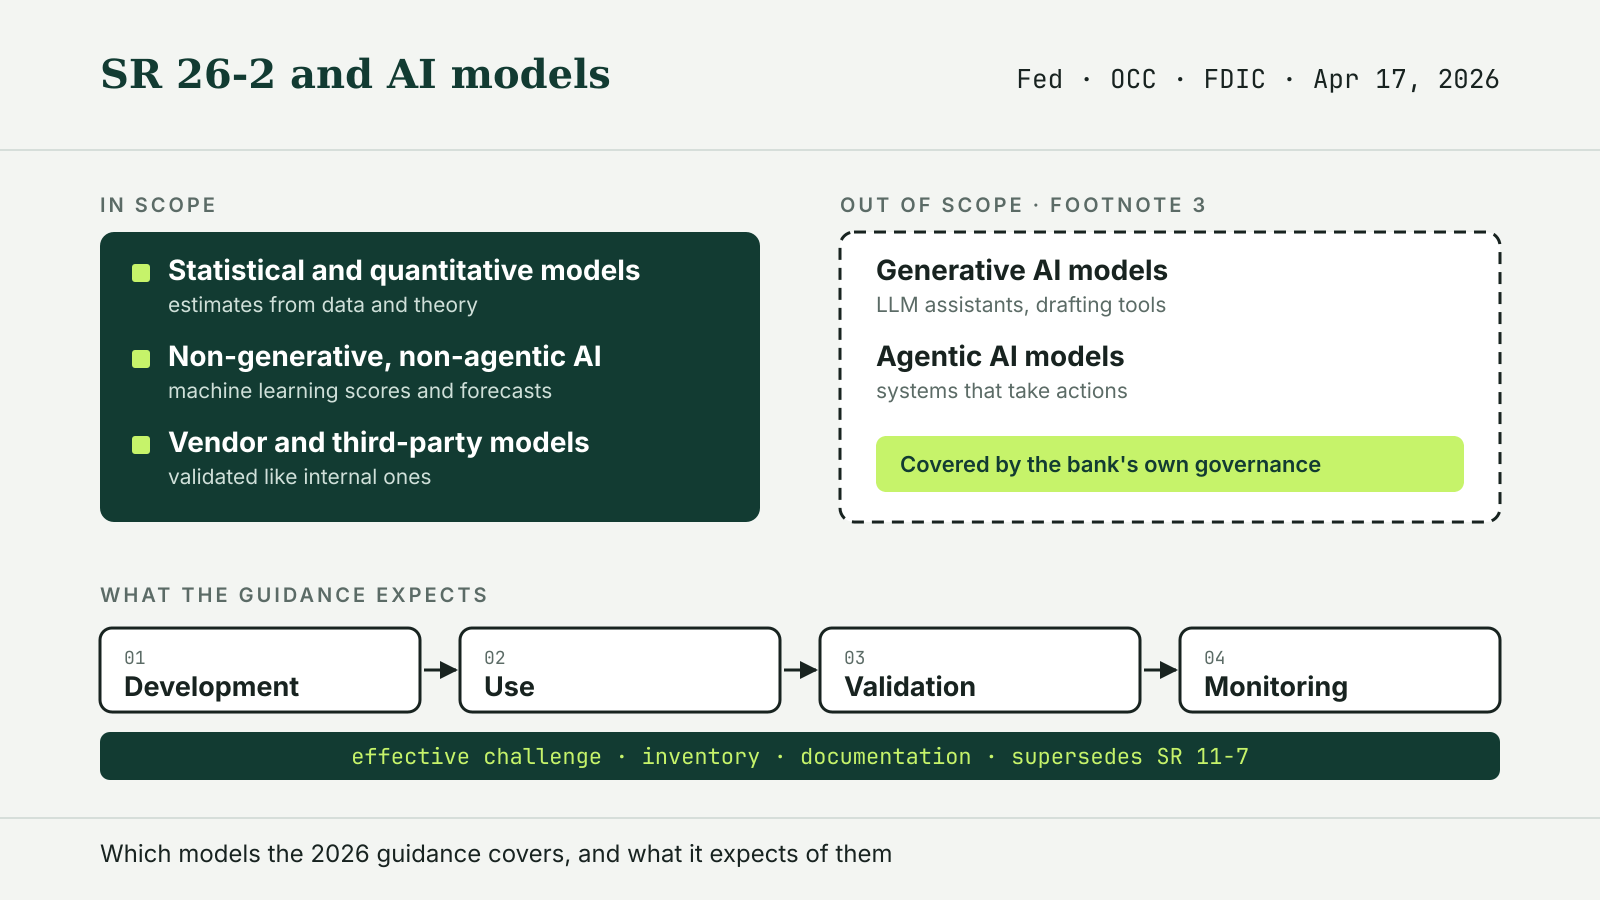
Diagram of SR 26-2 scope: statistical models, non-generative AI and vendor models in scope; generative and agentic AI out of scope; lifecycle from development to monitoring
SR 26-2 ·

SR 26-2 Model Risk Management and Where AI Models Fit

The 2026 interagency guidance replaced SR 11-7 and left generative and agentic AI out of scope.
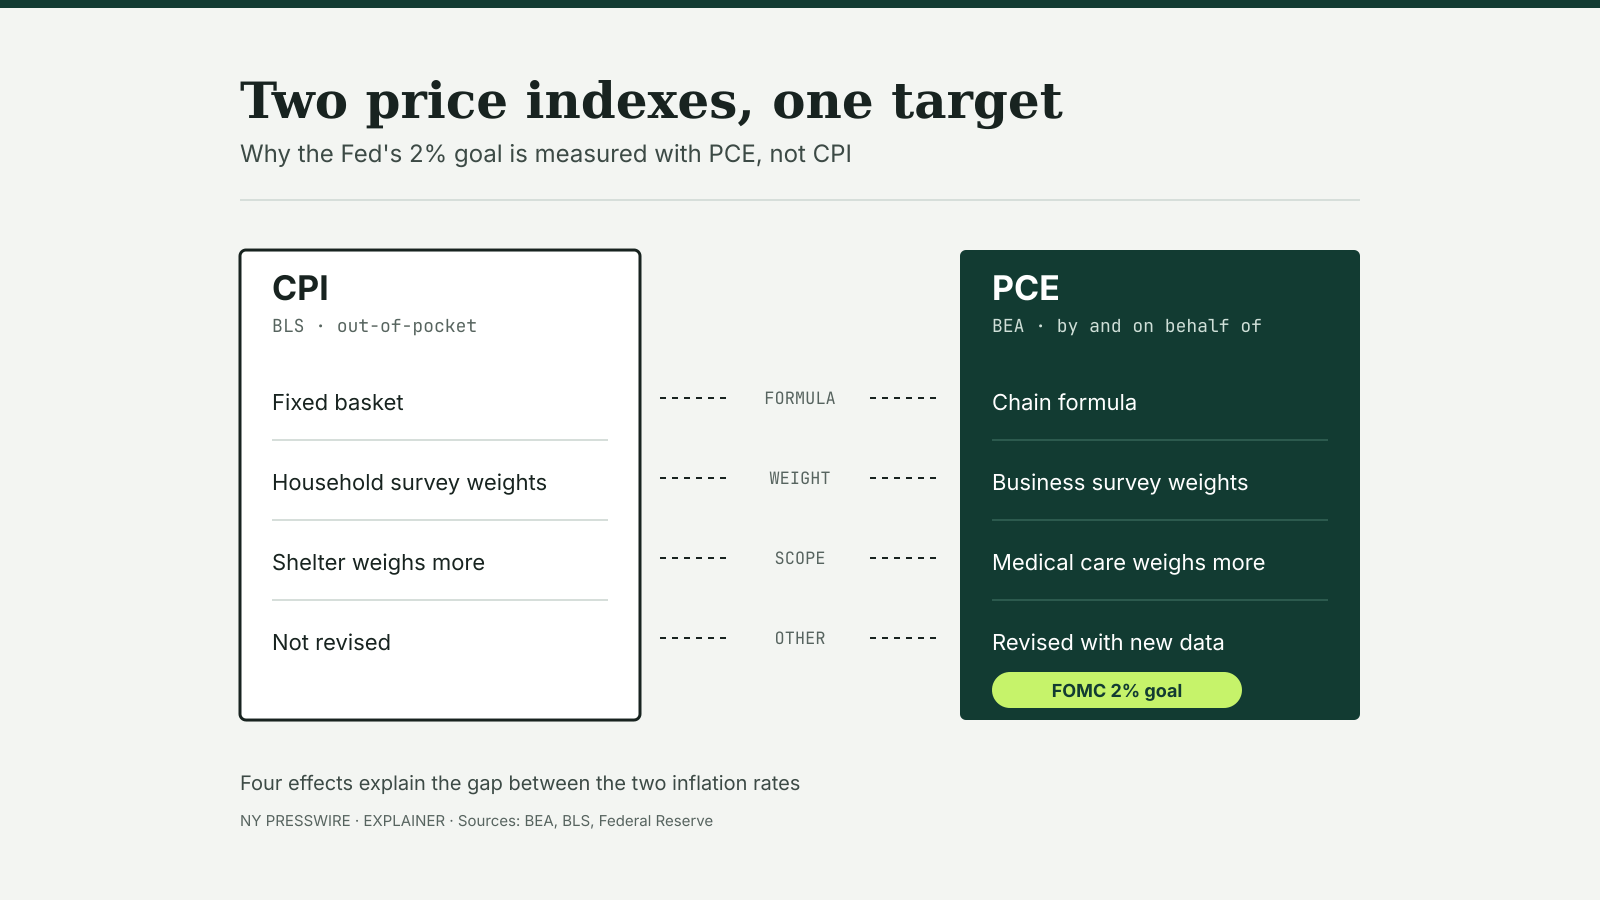
Diagram comparing the CPI and the PCE price index across formula, weight, scope and other effects, with PCE marked as the measure for the FOMC's 2% goal
PCE ·

PCE vs CPI: Why the Fed Targets a Different Inflation Gauge

PCE vs CPI with September 2026 readings: why the two split, why core PCE ran above core CPI, and why the Fed uses PCE.
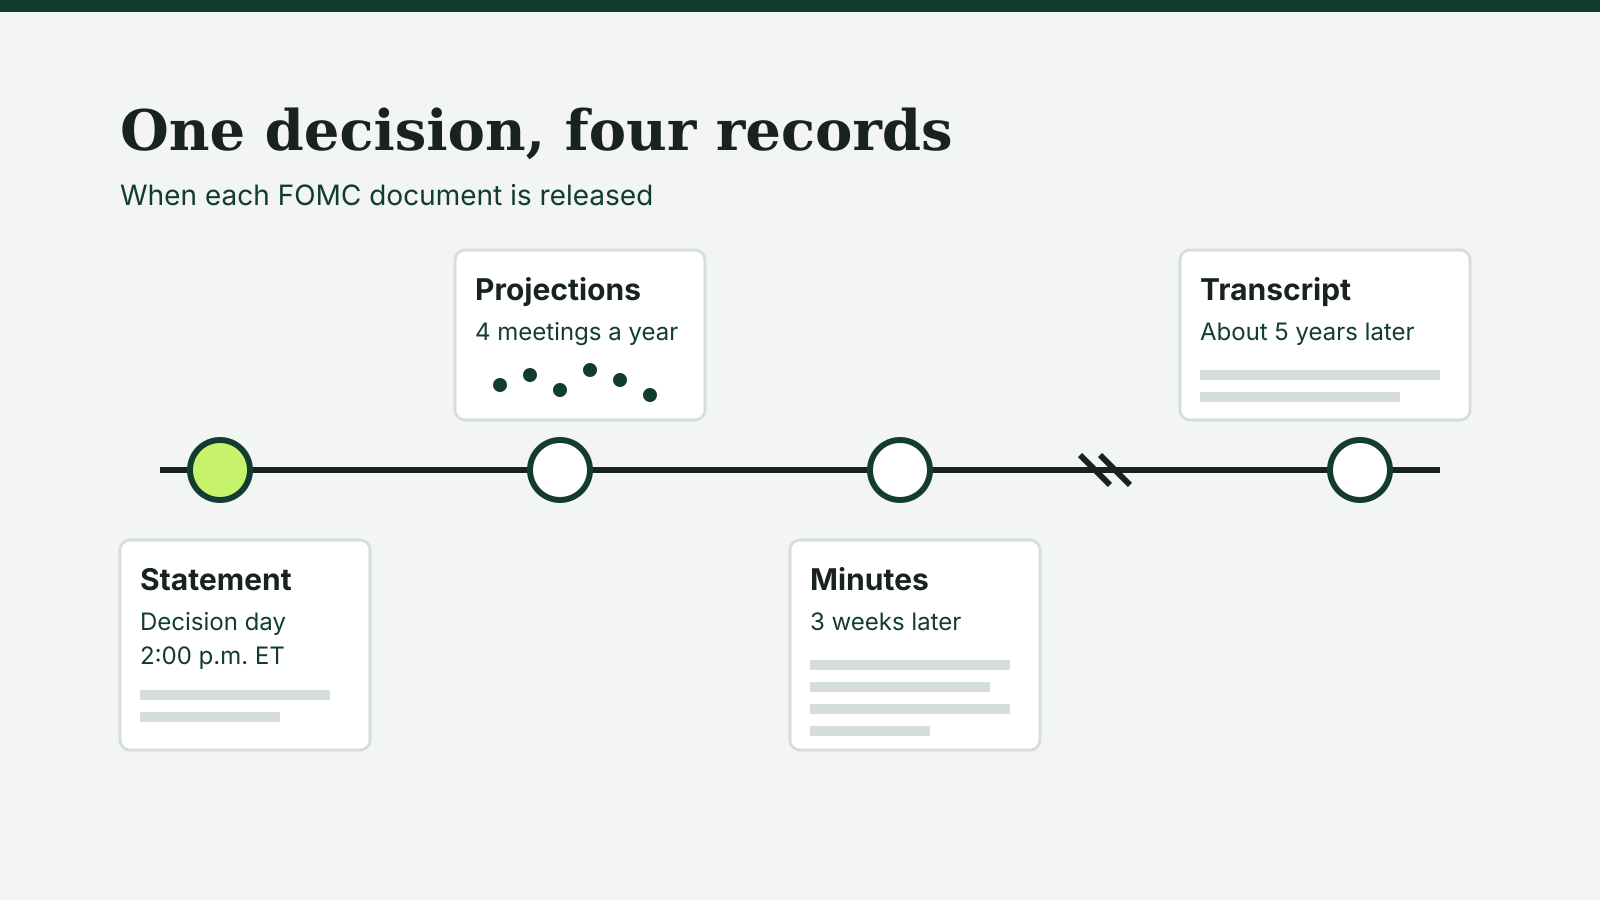
Timeline of FOMC documents: the statement on decision day at 2:00 p.m., projections at four meetings a year, minutes three weeks later and the transcript about five years later.
Federal Reserve ·

FOMC Statement vs Minutes: What Each Fed Release Tells You

The statement is the decision on the day; the minutes are the debate, released three weeks later.

NY Presswire

What are you looking for?

Search a topic or question