The Federal Reserve’s 2% inflation goal is not written in terms of the Consumer Price Index. It is written in terms of the PCE price index, a measure most households never see on a receipt. PCE vs CPI comes down to a few design choices: who is counted as paying, how spending is weighted and which formula combines the prices. Those choices usually leave PCE inflation a little below CPI inflation, though not always.
This explainer sets out what each index measures, where the gap comes from and how to read the two together. It draws on Bureau of Economic Analysis and Bureau of Labor Statistics documentation and on the FOMC’s own statement of goals, reviewed October 10, 2026.
Two agencies, two questions
The CPI comes from the Bureau of Labor Statistics. BLS describes it as the average change in prices paid by urban consumers for a basket of goods and services, measured from their out-of-pocket spending. Our explainer on how CPI is calculated covers its sampling, weights and quality adjustments.
The PCE price index comes from the Bureau of Economic Analysis. BEA defines it as a measure of the prices that people living in the United States, or those buying on their behalf, pay for goods and services. It is published each month in the Personal Income and Outlays report, and quarterly figures arrive with GDP.
That phrase “on their behalf” is the first big difference. BEA counts what an employer’s health plan or Medicare pays for a doctor’s visit as consumer spending, because the household consumes the service. The CPI counts only what the household pays itself.
Where the gap comes from
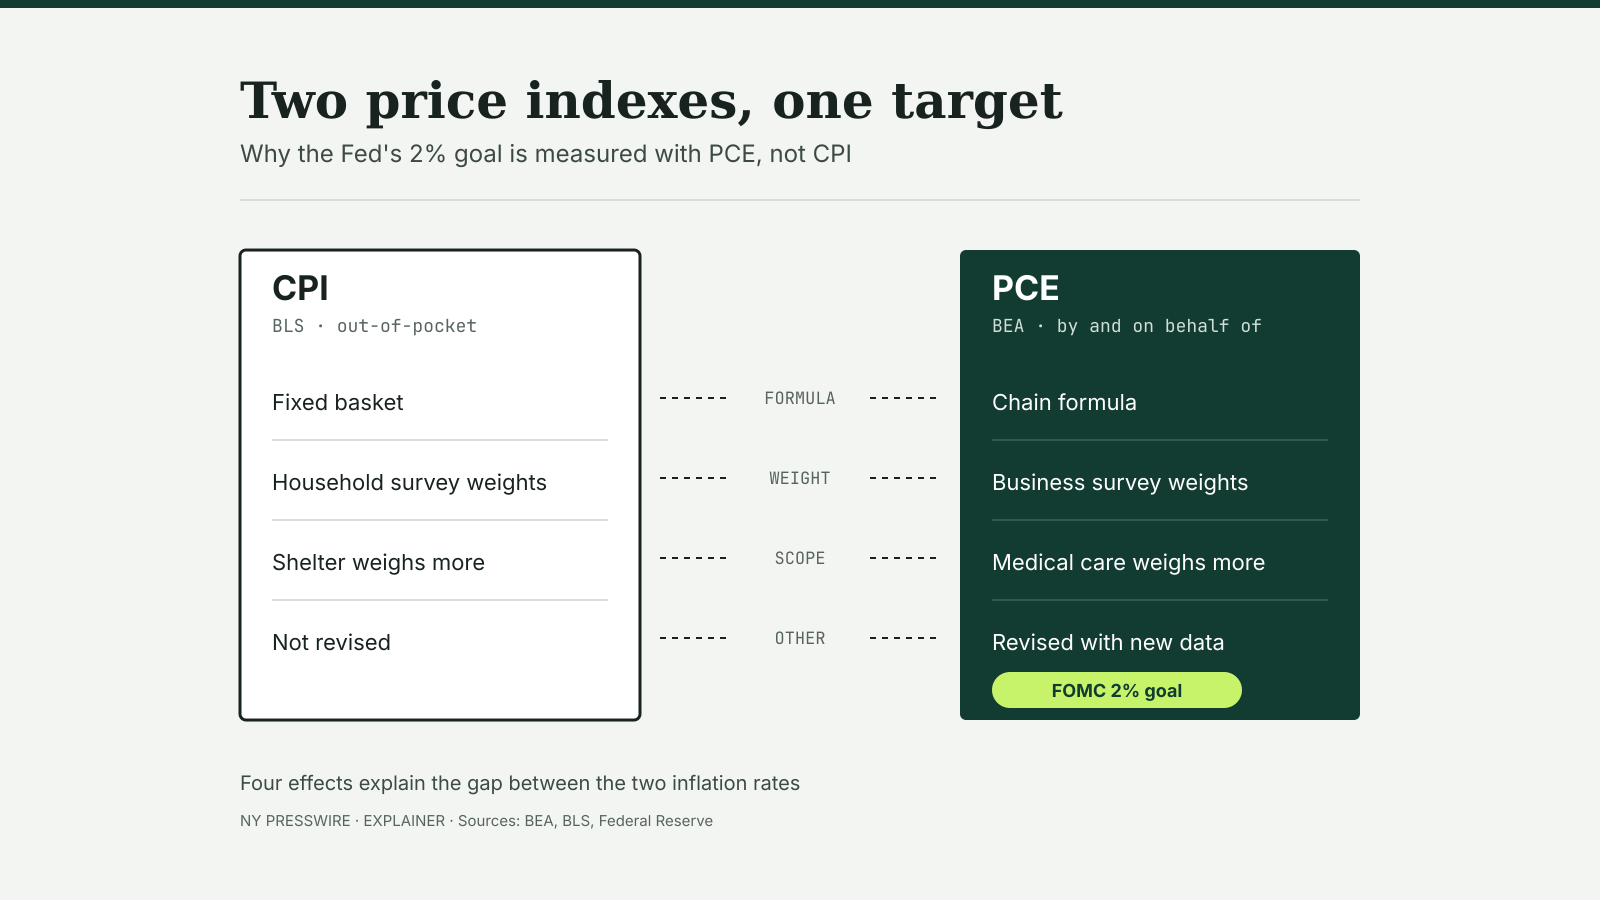
BEA and BLS split the difference between the two indexes into four parts, and BEA publishes a regular reconciliation of the two.
| Effect | CPI | PCE price index |
|---|---|---|
| Formula | Modified Laspeyres: a basket fixed between updates | Fisher-Ideal chain: the mix of spending can change from one period to the next |
| Weights | From the Consumer Expenditure Survey, a household survey | From business surveys such as Census retail and services surveys |
| Scope | Out-of-pocket spending by urban households | Spending by and on behalf of all households and nonprofits serving them |
| Other | BLS seasonal adjustment and price data | BEA seasonal adjustment, some different price data and revisions |
Formula. A Fisher index lets the weights follow what people actually buy, so when one item becomes expensive and shoppers switch to a substitute, the index reflects the switch. Economists call this a “superlative” index. A fixed basket keeps counting the expensive item at its old weight, which tends to push measured inflation higher.
Weights. Housing is the biggest example. In a 2006 BEA comparison using December 2004 weights, shelter made up 32.7% of the CPI but 15.0% of the PCE price index. Medical care went the other way: 6.1% of the CPI against 20.3% of PCE. Those figures are two decades old and the shares have moved since, but the pattern is why rents and medical prices pull the two indexes in different directions.
Scope. Because PCE includes medical care paid by insurers and government programs, faster medical inflation raises PCE more than CPI. Some CPI items, in turn, are outside PCE.
Other effects. These include different seasonal adjustment and revision schedules. The CPI-U is not revised after release, apart from its seasonal factors; PCE figures are revised as BEA receives fuller data.
BEA’s FAQ gives a worked example. In the third quarter of 2006, the PCE price index rose at a 3.0% annual rate and the CPI at 3.7%. Of the 0.7-point gap, the weight effect added 0.84 point, mostly from owners’ imputed rent (0.56) and gasoline (0.19); other effects added 0.29, mostly seasonal adjustment; the formula added 0.16; and the scope effect subtracted 0.50, mostly because PCE includes hospital and nursing home services paid on households’ behalf. Over 2002 to mid-2007, BEA’s reconciliation found the CPI rising about 0.4 percentage point a year faster. The size and even the sign of the gap vary, so treat these as examples, not a rule.
Why the Fed targets PCE
The FOMC’s Statement on Longer-Run Goals and Monetary Policy Strategy, most recently reaffirmed in January 2026, states the goal directly: inflation “at the rate of 2 percent, as measured by the annual change in the price index for personal consumption expenditures.” The Committee’s quarterly projections are also given as PCE and core PCE inflation, as our guide to FOMC statements, minutes and projections shows.
The Fed’s choice follows from the differences above. PCE covers a broader range of consumer spending, including what is paid on households’ behalf, and its chain formula captures substitution between goods. Its history can also be revised as better data arrive, which suits a measure used to judge a long-run goal.
None of that makes the CPI less important. It is published earlier in the month, it is not revised, and CPI measures are written into Social Security cost-of-living adjustments (the CPI-W), federal tax bracket indexing (the chained CPI-U) and many private contracts.
Headline, core and the release calendar
Both agencies publish a “core” measure that removes food and energy. Core PCE is the PCE price index excluding food and energy; core CPI is the CPI for all items less food and energy. Food and energy prices swing more from month to month, so core measures are read as a guide to the underlying trend, while the headline numbers are what households pay.
The CPI usually arrives first, around the middle of the month. The PCE price index follows near the end of the month in BEA’s Personal Income and Outlays release. Both are published at 8:30 a.m. Eastern. The dates are on our CPI release schedule and personal income and outlays schedule. BEA’s PCE page listed August 2026 PCE inflation at 3.4% over the year, published September 30, with the next release set for October 29.
Reading the two together
- Compare like with like. Match headline to headline and core to core, and use the same period, usually 12-month changes.
- Expect a gap, but check its source. A wider-than-usual gap often points to shelter, which weighs more in the CPI, or medical care, which weighs more in PCE.
- Watch for revisions. A PCE number from three months ago may not be the number first published.
- Use the CPI as an early signal. Much of the price data inside PCE comes from BLS, so analysts use the CPI and PPI to estimate PCE before BEA publishes it.