The Fed’s Beige Book is a qualitative report on economic conditions across the twelve Federal Reserve Districts, based on information from business and community contacts. It is useful when a headline number leaves a practical question unanswered: are firms finding workers, passing on costs or delaying investment? Read it as an organized collection of regional observations, with clear limits on what those observations can establish.
What the Beige Book contains
The Federal Reserve’s publication overview describes a report issued eight times a year, combining information from the twelve Reserve Bank Districts. A rotating Reserve Bank prepares the national summary.
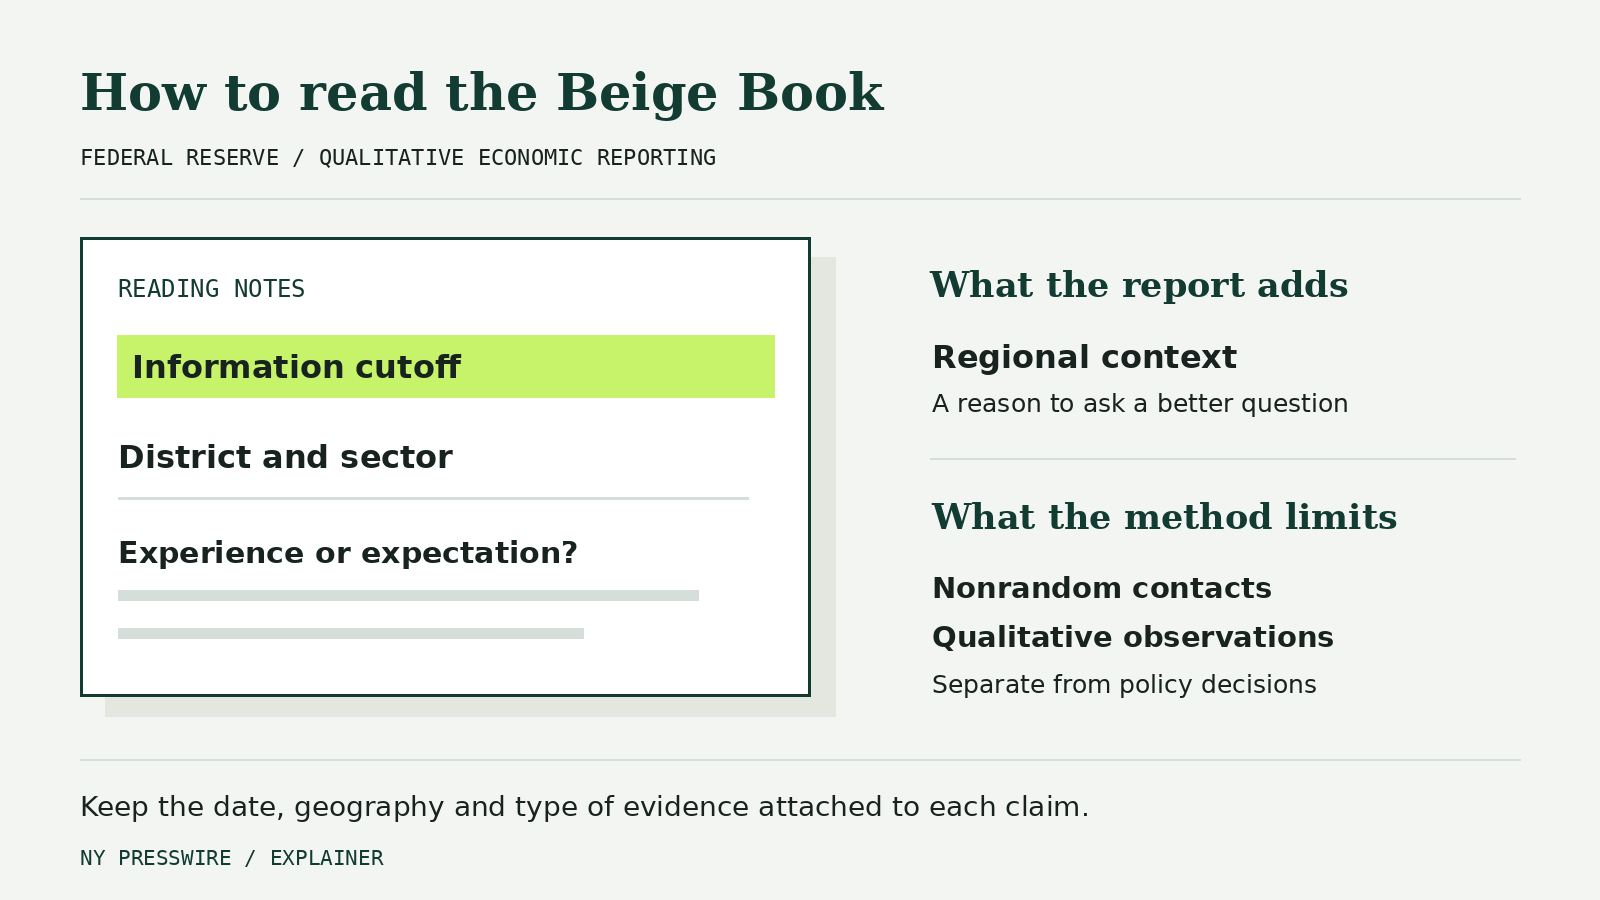
The October 2026 methodology page explains that the information is mostly qualitative. Reserve Banks gather it through directors’ reports, interviews and questionnaires involving businesses, community organizations and other contacts. Contacts are deliberately selected to provide a broad range of information; they are not a random sample.
That design can surface explanations worth investigating. It does not turn the report into a representative poll of every household or business. Nor is it a statement of Federal Reserve officials’ views. The publication explains that distinction explicitly.
Check the information date before the headline
The publication date and the information cutoff answer different questions. The October national summary was updated on October 14, 2026 and says it used information collected on or before October 5. It therefore cannot be read as an observation of every development through its release day.
Put those dates beside any comparison you make. A company announcement after the collection cutoff cannot explain a contact’s earlier observation unless additional evidence establishes the connection. Equally, a later statistical release may describe a different period from the interviews summarized in the report.
For release dates, use the separate economic calendar. This guide explains how to read the report rather than reproduce or update the calendar’s schedule.
Read the national summary, then the relevant District
The national summary provides a starting point for identifying patterns across Districts. A regional report gives those patterns more context. Read both before describing a local observation as a national conclusion.
For example, the October New York District report described slight overall activity growth led by manufacturing, while services were little changed on balance. It also discussed differing conditions across firms and customers. Those observations illustrate why an overall description can coexist with uneven experiences beneath it.
A useful reading note would keep the geography and sector attached to the observation. “Manufacturing contacts in this District” is more informative than a rewritten statement about “businesses” generally. Preserve the distinction when turning a regional paragraph into a product-planning assumption or a presentation slide.
Separate what happened from what contacts expect
The report can describe current conditions and expectations for the coming months within the same paragraph. Mark those as different kinds of evidence. An observed change in orders and a contact’s forecast of future orders should not become one assertion about an established trend.
Try a hypothetical reading exercise. A business says input costs rose and that it plans to raise selling prices. A useful note separates the reported cost change from the pricing intention. It then asks what later evidence could establish whether the planned increase occurred. The hypothetical is a method for reading the report, not a quotation from a particular contact.
The same approach works for hiring. Difficulty finding a specialist, a plan to add employees and a measured increase in payrolls describe different questions. A narrative account can help explain a mechanism, while a statistical series can help assess its scale.
Pair the narrative with a suitable statistical release
Start with the question you need to answer. If the issue is how a price index is constructed, use the relevant statistical methodology rather than extracting an inflation estimate from descriptive language in the Beige Book. Our CPI guide explains the collection and weighting behind that index.
If the question concerns employment, distinguish a contact’s account from the surveys behind the jobs report. The establishment and household survey comparison explains why those surveys can produce different measures.
Use the Beige Book to develop a more precise follow-up question. A report of difficulty recruiting a particular occupation might lead you to examine occupation-specific evidence, geography or employer requirements. It should not automatically become a claim that labor is scarce everywhere.
Keep a compact evidence note
For each passage you use, record the edition, information cutoff, District, sector and whether the wording reports experience or an expectation. Add the public source link and the separate data series you would use to check the claim’s scale. This is a recommended reading method, not a form required by the Federal Reserve.
Then write down the limitation that matters for your decision. A nonrandom contact set may identify a problem without measuring how common it is. A regional account may be valuable for a local planning question while being insufficient for a national estimate. A reported intention may warrant monitoring without being treated as a completed change.
The Beige Book also differs from the FOMC’s policy communications. Use our statement, minutes and projections guide when the question is what the committee decided or published about policy. Keep a contact’s economic observation attached to the contact-based report that actually supports it.