The Senior Loan Officer Opinion Survey on Bank Lending Practices, or SLOOS, is the Federal Reserve Board’s quarterly poll of loan officers at up to 80 large US banks and 24 US branches of foreign banks. They answer one kind of question again and again: over the past three months, did your bank tighten or ease its standards for this type of loan, and did borrower demand get stronger or weaker? The Board reports the answers as net percentages (survey home page).
Most coverage repeats the Board’s summary words, such as “tightened” or “basically unchanged.” Those words sit on top of small counts of banks. Below, we take the October 2026 survey, posted on November 2, 2026, back to the bank counts in its Table 1.
Who answers, and about what
The October 2026 round went out on September 21 and was due back on October 5. Responses came from 61 domestic banks and 18 US branches and agencies of foreign banks. Unless a line says otherwise, every figure in the summary and in this article is for the domestic banks.
The panel is drawn from the largest banks in each Federal Reserve District. Table 1’s footnote puts the panel’s assets at $15.9 trillion, against $22.5 trillion for all federally insured commercial banks chartered in the US. By our arithmetic that is about 71 percent of the total. Twenty-two of the 61 count as “large banks,” meaning $100 billion or more in domestic assets on June 30, 2026.
The core questions cover four loan groups: commercial and industrial (C&I) loans, commercial real estate, residential mortgages and home equity lines, and consumer loans (credit cards, autos and the rest). Most rounds add special questions on a topic of the moment. In October there were two sets: credit card approvals by borrower credit score over the past year, and lending to nondepository financial institutions (NDFIs).
How a net percentage is built
For standards and terms, the Board’s definition is the share of banks that tightened considerably or somewhat, minus the share that eased considerably or somewhat. For demand, it is the share reporting stronger demand minus the share reporting weaker demand. Banks that answer “basically unchanged” count in the total but not in the net.
Two consequences follow. A net percentage is not the share of banks that changed anything. And each bank counts once, whatever its size: the percentages in Table 1 are plain bank counts divided by the number of banks that answered.
The summary has its own vocabulary. In the October 2026 text, “remained basically unchanged” means a net percentage from 0 to 5 percent. Anything above 5 is described as a change.
Worked example: “standards tightened for small firms”
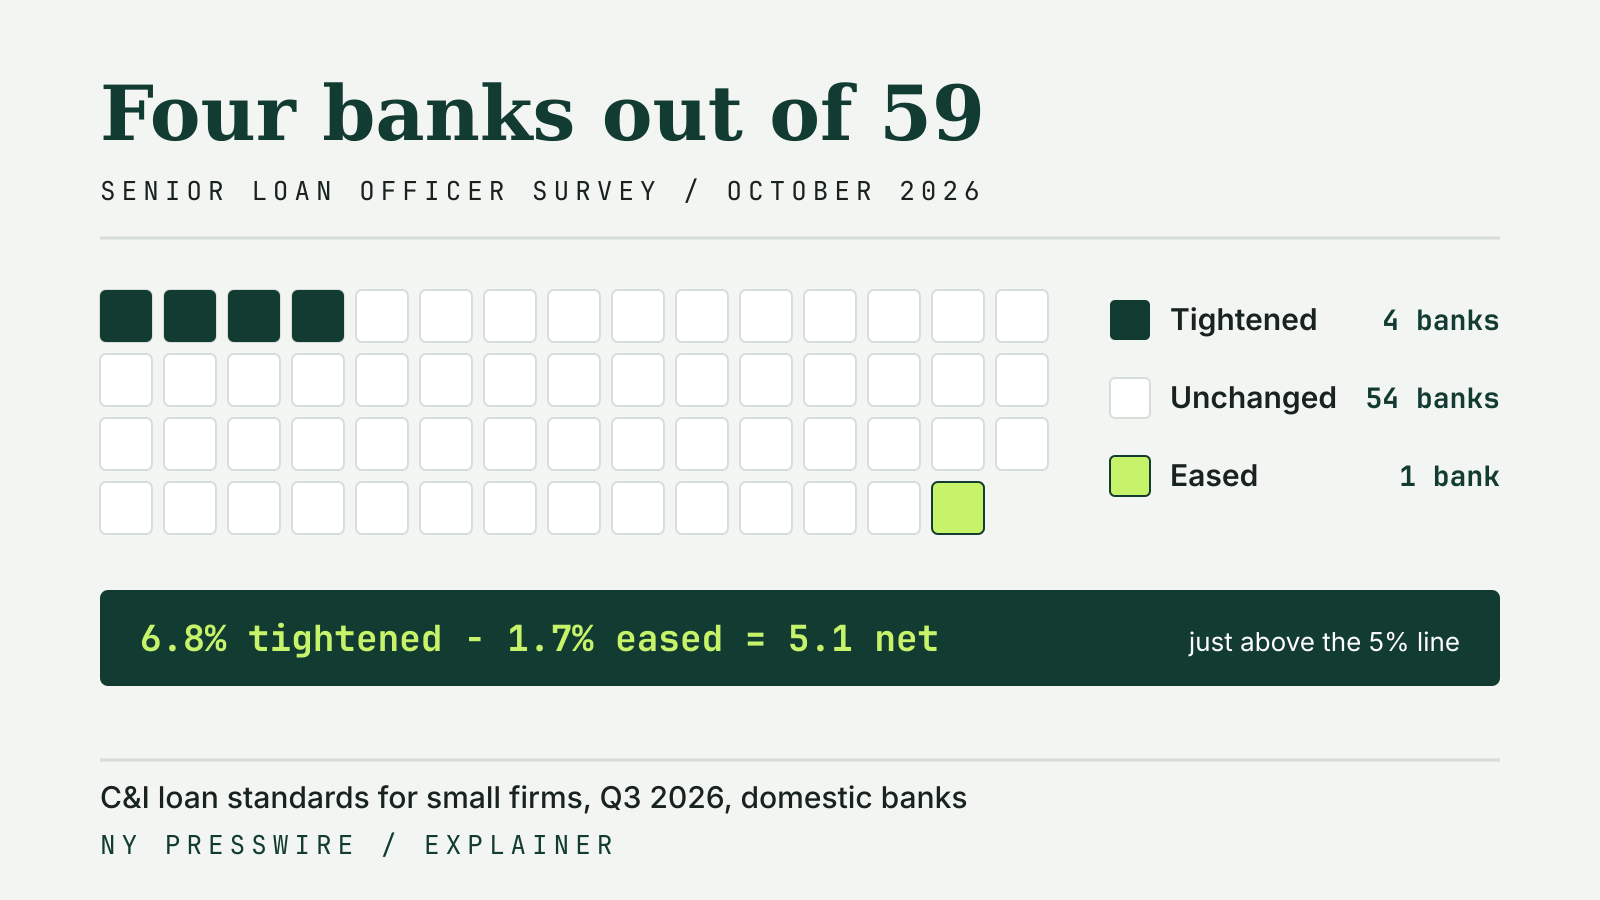
The October summary says C&I standards for loans to large and middle-market firms were basically unchanged, while standards for small firms (annual sales under $50 million) tightened. Question 1 in Table 1 has the counts:
| C&I standards, Q3 2026 | Large and middle-market firms | Small firms |
|---|---|---|
| Banks answering | 60 | 59 |
| Tightened somewhat | 4 (6.7%) | 4 (6.8%) |
| Basically unchanged | 53 (88.3%) | 54 (91.5%) |
| Eased somewhat | 3 (5.0%) | 1 (1.7%) |
| Net percentage tightening | 1.7 | 5.1 |
No bank tightened or eased “considerably” for either group.
Small firms: 6.8 − 1.7 = 5.1. That is 0.1 point above the 5 percent ceiling for “basically unchanged,” so the summary calls it tightening. Behind the word are four banks out of 59. If one of them had answered “unchanged” instead, the net would have been 3 ÷ 59 − 1 ÷ 59 = 3.4 percent, and the sentence would have read “basically unchanged.”
The same table splits the answers by bank size. None of the 21 large banks that answered tightened small-firm standards. All four tightening banks were in the group with less than $100 billion in domestic assets.
The summary is accurate by its own rule. It is still worth quoting the number, not the verb: a net 5.1 from four banks says much less than a net 40.
Watch the response count
Some lines rest on very few banks. Ten banks answered the question on subprime mortgage standards in October. Two tightened and none eased, so the net reads 20.0 percent, the same arithmetic as two banks out of ten. The Board does not publish a mortgage series at all when three or fewer banks respond, according to the notes to its chart data. Check the “Total” row in Table 1 before quoting any line.
October 2026 against July 2026
The chart data file carries each net percentage back through time. These lines moved the most between the July and October 2026 rounds:
| Net percentage, domestic banks | July 2026 survey | October 2026 survey |
|---|---|---|
| C&I standards, large and middle-market firms | 0.0 | 1.7 |
| C&I standards, small firms | 1.8 | 5.1 |
| C&I demand, large and middle-market firms | 16.1 | −11.7 |
| C&I demand, small firms | 3.6 | −11.9 |
| CRE standards, construction and land development | −3.7 | 15.5 |
| CRE standards, nonfarm nonresidential | −11.3 | 8.8 |
| CRE standards, multifamily | −5.7 | 8.8 |
| CRE demand, construction and land development | −11.1 | −25.9 |
| Mortgage demand, GSE-eligible | −11.8 | −32.1 |
| Credit card standards | 6.7 | 4.0 |
| Credit card demand | 2.2 | 10.2 |
| Auto loan demand | −11.4 | −12.5 |
Positive standards numbers mean net tightening; negative demand numbers mean net weaker demand. Commercial real estate is the clearest turn: in July, more banks eased than tightened in all three property categories, and by October more tightened in all three. Business loan demand went from net stronger to net weaker for firms of every size. Credit cards were the one consumer category where the Board reported stronger demand.
The special questions on NDFIs found net tightening for every type of borrower asked about, from 15.4 percent for private equity funds to 22.0 percent for business credit intermediaries. The reasons banks cited most often were a less favorable or more uncertain economic outlook and weaker finances at the NDFI borrowers themselves.
The quarter label trap
The October survey describes the third quarter of 2026: the questions ask about the past three months, and the summary says so. But the Board’s chart data stamps the October results “2026:4,” and FRED does the same. The FRED series for small-firm C&I standards lists 5.1 under “Q4 2026,” updated November 2, 2026. Before you line SLOOS up against GDP or bank loan growth, shift it back one quarter, or you will compare third-quarter lending with fourth-quarter output.
Where the survey fits
The Board times the survey so results are ready for four FOMC meetings a year: January or February, April or May, August, and October or November (about the SLOOS). The October 2026 round was due back on October 5, ahead of the committee’s October 27–28 meeting, while the public results came out on November 2.
The Beige Book is the Fed’s other survey of conditions, and it works differently: a narrative by district, with no net percentages. Our guide to the Beige Book shows how to read it. Read together, the SLOOS gives you the direction of credit at large banks, and the Beige Book gives you the regional detail behind it.