The Fed’s H.4.1 release is its weekly balance sheet. The Board publishes it on Thursday afternoon, usually around 4:30 p.m. Eastern, and the figures are as of the day before (about the release). Two tables answer most questions. Table 5 is the balance sheet itself on Wednesday. Table 1 regroups the same accounts into what supplied and what absorbed bank reserves, and shows weekly averages beside the Wednesday level.
The quickest way to learn the release is to take one week apart. The release of November 5, 2026 is a useful one: bank reserves rose $67.6 billion from one Wednesday to the next, while the Fed’s total assets grew by only $2.5 billion. Every figure below comes from that release, which reports in millions of dollars; we round to billions.
Which table answers which question
The release has seven tables. Five of them cover nearly everything readers ask about.
| Table | What it holds | Go here when you want |
|---|---|---|
| 1. Factors affecting reserve balances | Weekly averages, changes and the Wednesday level for every factor that adds or drains reserves | The reason reserves moved |
| 1A. Memorandum items | Securities the New York Fed holds in custody for foreign official accounts; securities lent to dealers | Foreign official holdings of Treasuries. These are not the Fed’s own assets |
| 2. Maturity distribution | Holdings by remaining maturity, from 15 days to over 10 years | How much of the portfolio matures soon |
| 5. Consolidated statement of condition | Assets, liabilities and capital of all 12 Reserve Banks on Wednesday | The size of the balance sheet and its liabilities |
| 6. Each Reserve Bank | The same statement split by district | District detail, and the earnings remittances line |
Table 3 adds detail on mortgage-backed securities, Table 4 covers the remaining Main Street lending facility, and Table 7 lists the collateral behind Federal Reserve notes.
Averages or Wednesday: pick one and stay with it
Table 1 prints two kinds of number for each line. The first column is an average of daily figures for the week ended Wednesday. The last column is the level on Wednesday alone. They can tell different stories. For the week ended November 4, 2026:
| Reserve balances | Level | Change |
|---|---|---|
| Weekly average | $2,930.1 billion | +$36.3 billion from the week ended October 28 |
| Wednesday, November 4 | $2,962.8 billion | +$67.6 billion from Wednesday, October 28 (Table 5) |
Table 1’s change columns compare averages with averages. Table 5’s change columns compare one Wednesday with the previous one. A chart labeled “Fed reserves” can use either, so check which column it uses before you compare it with anything.
Worked example: where $67.6 billion of reserves came from
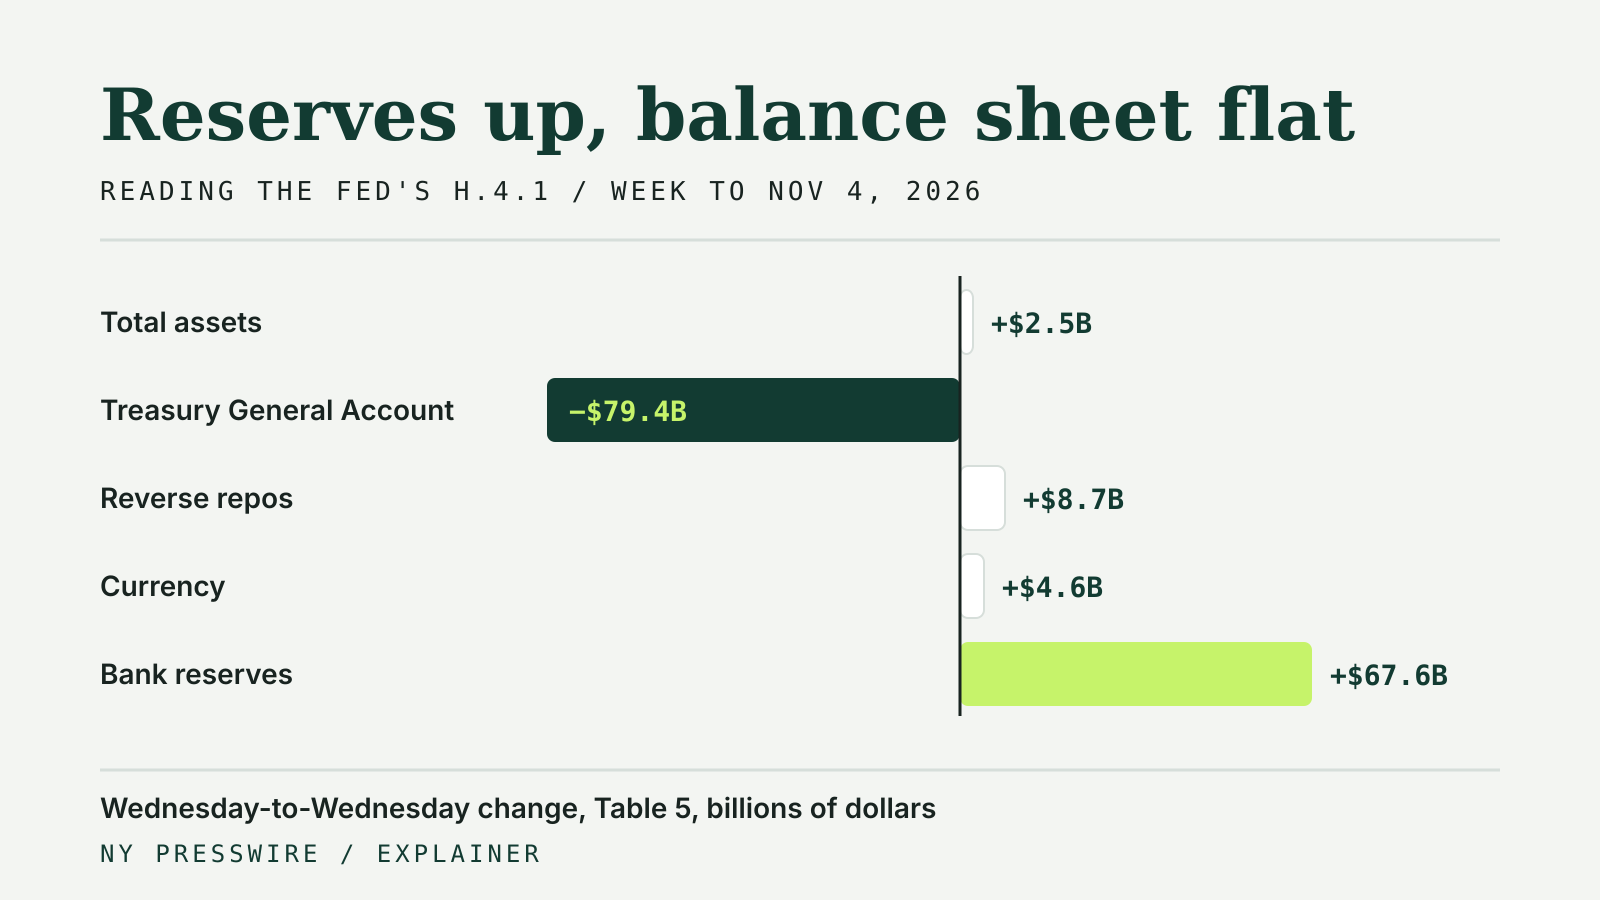
The Fed’s assets equal its liabilities plus capital. Reserves are one liability, so when they rise, either assets rose or another liability fell. Table 5 shows which. From Wednesday, October 28 to Wednesday, November 4, 2026:
| Line in Table 5 | Change |
|---|---|
| Total assets | +$2.5 billion |
| Federal Reserve notes (currency) | +$4.6 billion |
| Reverse repurchase agreements | +$8.7 billion |
| U.S. Treasury, General Account (TGA) | −$79.4 billion |
| Other deposits | +$3.0 billion |
| Other liabilities and capital | −$1.9 billion |
| Reserves (other deposits held by depository institutions) | +$67.6 billion |
We checked that the lines close. The liability and capital changes add up to the $2.5 billion rise in assets, give or take rounding in the published figures. The arithmetic for reserves, in billions: 2.5 − 4.6 − 8.7 + 79.4 − 3.0 + 1.9 ≈ 67.6.
The asset side barely moved. Almost all of the reserve increase came from the Treasury’s cash account, which fell $79.4 billion to $936.2 billion. When the Treasury pays out more than it takes in, money leaves its account at the Fed and lands in commercial banks’ accounts as reserves. The release shows that the shift happened. It does not say why the Treasury’s balance fell, so for the payments behind it go to the Treasury’s Daily Treasury Statement.
The weekly averages tell a smaller version of the same story. Table 1’s factors supplying reserves fell $4.2 billion on average, as mortgage-backed securities ran off by $6.7 billion and Treasury holdings rose $2.4 billion, while the factors absorbing them fell $40.5 billion, led by a $42.6 billion drop in the TGA. Supply minus absorption gives the $36.3 billion rise in average reserves.
Lines that are easy to misread
Securities are at face value. Footnote 2 says Treasury and agency holdings are shown at face value. Mortgage-backed securities are shown at their remaining principal balance. The unamortized premiums ($206.9 billion) and discounts (−$26.5 billion) sit on separate lines. Nothing on the release is a market price.
Reverse repos are a liability. The $334.5 billion on Wednesday was mostly foreign official and international accounts ($334.3 billion). The “Others” line, which covers the New York Fed’s overnight reverse repo operations with its eligible counterparties, was $0.2 billion. A rise in reverse repos drains reserves; the securities behind them stay on the Fed’s books.
The negative liability is the deferred asset. Table 6 lists “Earnings remittances due to the U.S. Treasury” at −$231.9 billion on November 4, 2026. Footnote 8 explains that a negative figure is the cumulative deferred asset, the net earnings the Reserve Banks must make before remittances to the Treasury resume. In the December 29, 2025 release the same line was −$242.1 billion, so the shortfall has shrunk by about $10.2 billion since late December. The Board has said a deferred asset has no implications for monetary policy or the Fed’s ability to meet its obligations.
Custody holdings are someone else’s. Table 1A’s $2,813 billion of securities held for foreign official accounts belongs to those account holders. Market watchers track it as a gauge of foreign official demand for Treasuries, as the Board’s own guide to the balance sheet notes.
Discount window loans are in Table 1. Primary credit averaged $10.0 billion in the week. How that facility differs from the standing repo facility is in our explainer on the discount window vs standing repo facility.
A weekly routine
- Open the dated release, not only the “current” page, and note the Wednesday it describes.
- Read Table 5 for the change in total assets.
- Read the liability changes for reserves, the TGA, reverse repos and currency, and check that they close against assets.
- Go to Table 1 if you need weekly averages, and keep averages and Wednesday levels apart.
- Read the footnotes before you name a cause.
The rate the Fed pays on those reserves, and how it steers the federal funds rate, is covered in federal funds target range vs effective rate.