The Consumer Price Index turns observed prices into a weighted measure of inflation for urban consumers. Understanding how CPI is calculated helps you read the monthly release without confusing a national average with your household’s own change in spending.
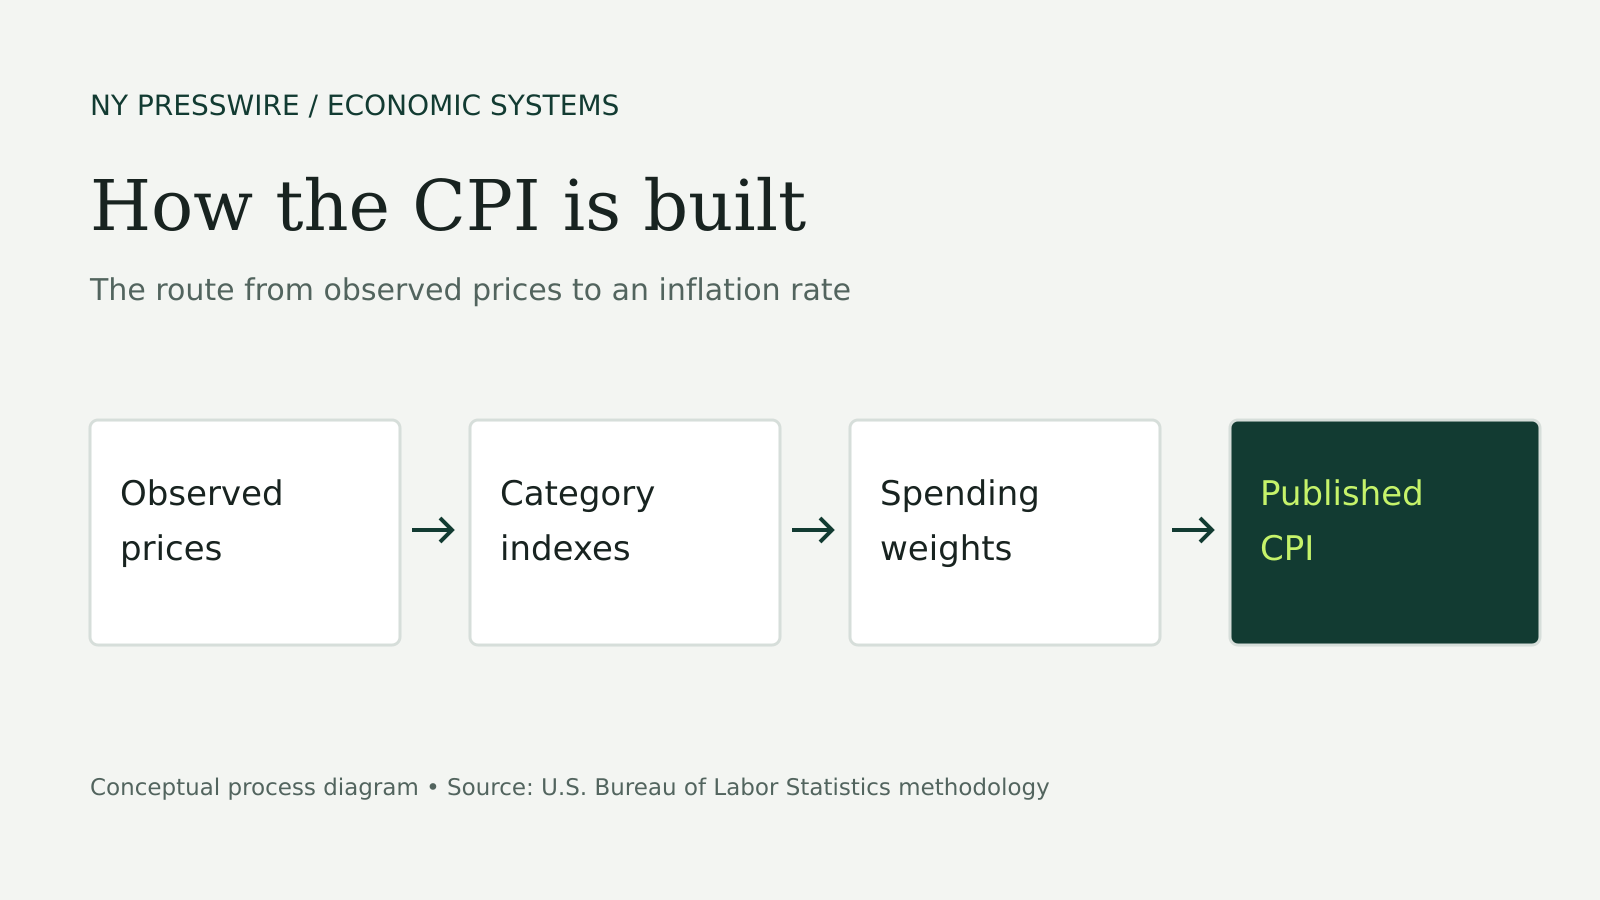
The Bureau of Labor Statistics (BLS) builds the index in stages. It measures price movements within item and location groups, combines those groups using expenditure weights, and publishes indexes for different populations and categories. Our US economic calendar tracks the release schedule; this guide explains what the release measures.
The basket starts with spending, not a shopping list
The CPI basket represents goods and services bought for consumption. Food, housing, transport and medical care belong in it. Purchases of stocks and bonds do not: those are investments rather than consumption. Sales taxes associated with a purchase can enter its price, while income tax is outside the basket.
BLS uses its Consumer Expenditure Surveys to establish the importance of different spending categories. A household that spends more on rent than on haircuts does not give those purchases equal influence. The national index applies the same principle across the spending patterns of the population it represents.
This also explains why a person’s experience can differ from the headline. A renter with a long commute and a homeowner who walks to work have different exposures to shelter and fuel. The index describes an average population, not either household’s budget.
Price collection follows specific products
A useful comparison holds the purchase as constant as possible. A price quote records a particular product or service at a selected outlet. Comparing a small pack last month with a larger pack this month without accounting for the difference would mix a price change with a quantity change.
BLS samples areas, outlets, items and housing units rather than surveying every purchase in the country. Its current calculation framework combines 243 basic items across 32 index areas, producing 7,776 item-area combinations. These basic cells are the building blocks of broader indexes.
Some categories use secondary datasets. The agency’s methodology also describes imputation for selected small categories. A published index therefore does not mean every underlying price was observed afresh during that month.
Basic indexes and expenditure weights do different jobs
Most commodity and service categories use a geometric mean formula at the basic-index stage. That formula combines price ratios for the sampled items. Selected categories use a modified Laspeyres formula instead.
At the next stage, BLS aggregates basic indexes using expenditure weights. For CPI-U and CPI-W, those aggregation weights come from the Consumer Expenditure Surveys and are updated annually. The weights decide how much each component contributes to the aggregate.
Consider an illustrative, simplified budget: housing has a 50% weight, food 30% and other purchases 20%. If their prices rise 4%, 2% and 1%, respectively, a simple fixed-weight calculation gives 2.8%: 0.50 × 4 + 0.30 × 2 + 0.20 × 1. These are invented teaching inputs, not actual CPI weights or the complete BLS formula. The example shows why a large component can dominate the result even when a smaller component rises faster.
Replacements require a quality comparison
Products disappear or acquire new specifications. BLS must decide whether a replacement differs in ways that affect the measured purchase. Otherwise, a more expensive product with added features would automatically count as pure inflation.
The calculation handbook describes direct comparison, quality adjustment and methods that estimate an unavailable comparison. The appropriate treatment depends on the product and available information. Quality adjustment aims to isolate price change for comparable consumption; it does not say that every buyer values an added feature equally.
Shrinkflation raises the related quantity question. If the package contains less while its ticket price stays unchanged, the price per equivalent quantity has increased. Looking only at the shelf label misses that change.
Read the series and the comparison period together
CPI-U covers urban consumers; CPI-W represents a narrower population of urban wage earners and clerical workers. The chained CPI-U uses a different upper-level aggregation approach, incorporating spending information from both periods to account for substitution across categories. Its initial estimates are revised as more expenditure information arrives.
The percentage change also needs a denominator. If an index rises from 300 to 309, the increase is 3%, calculated as (309 ÷ 300 − 1) × 100. A nine-point index increase is not nine percent.
Monthly seasonally adjusted changes and unadjusted year-over-year changes answer different questions. Seasonal adjustment removes recurring patterns to make adjacent months easier to compare; a twelve-month comparison looks across a much longer interval. Keep the series, adjustment basis and comparison period consistent when comparing releases.