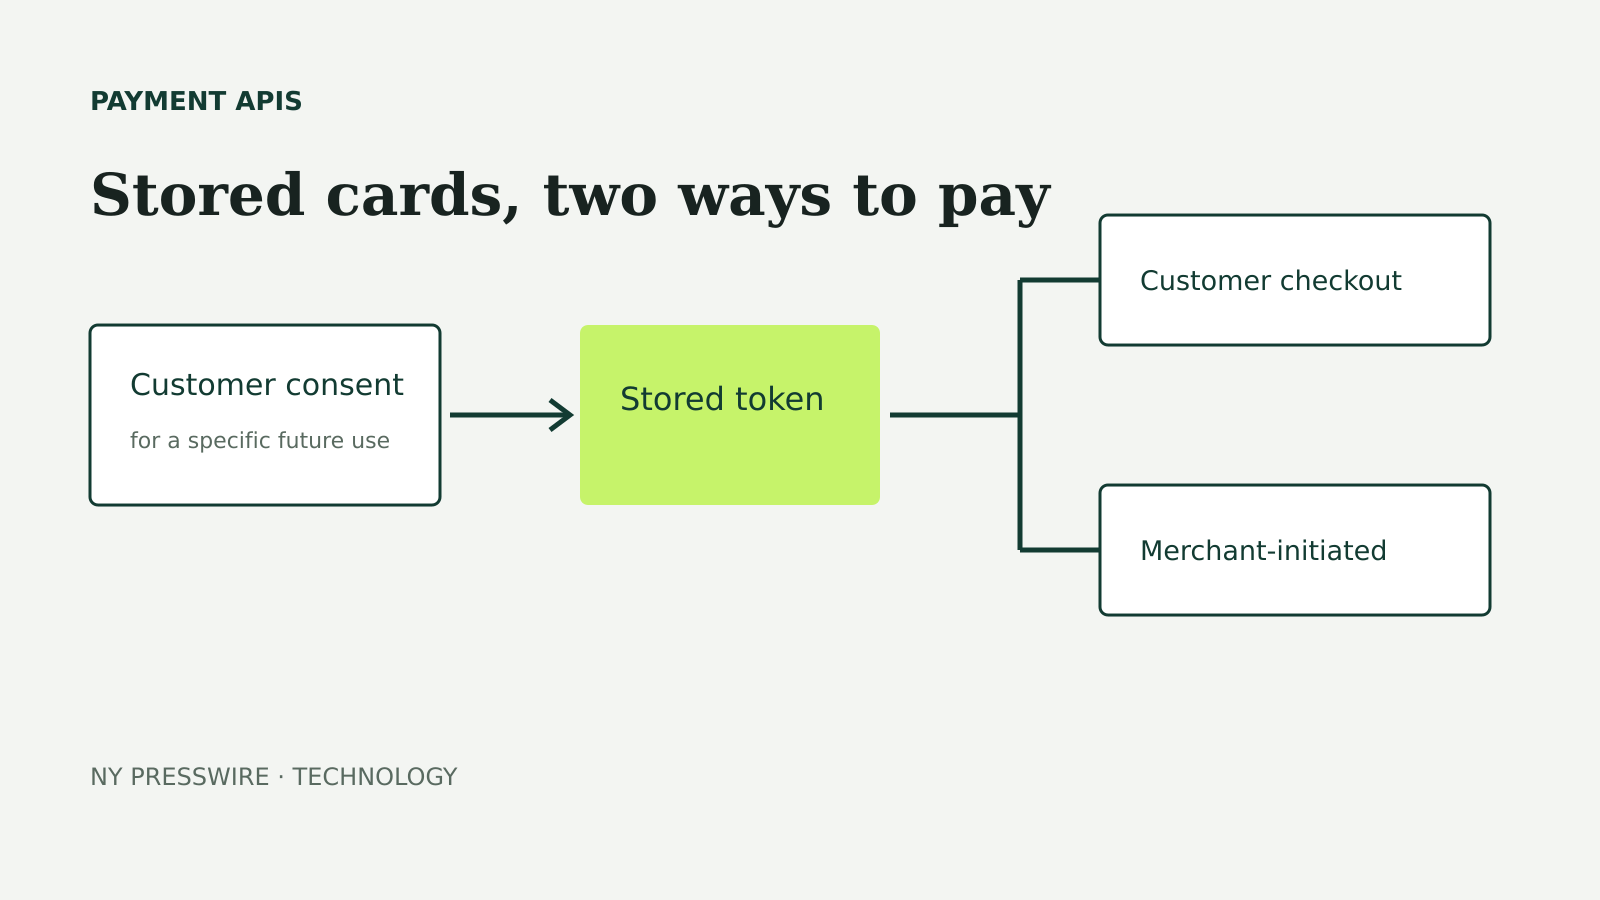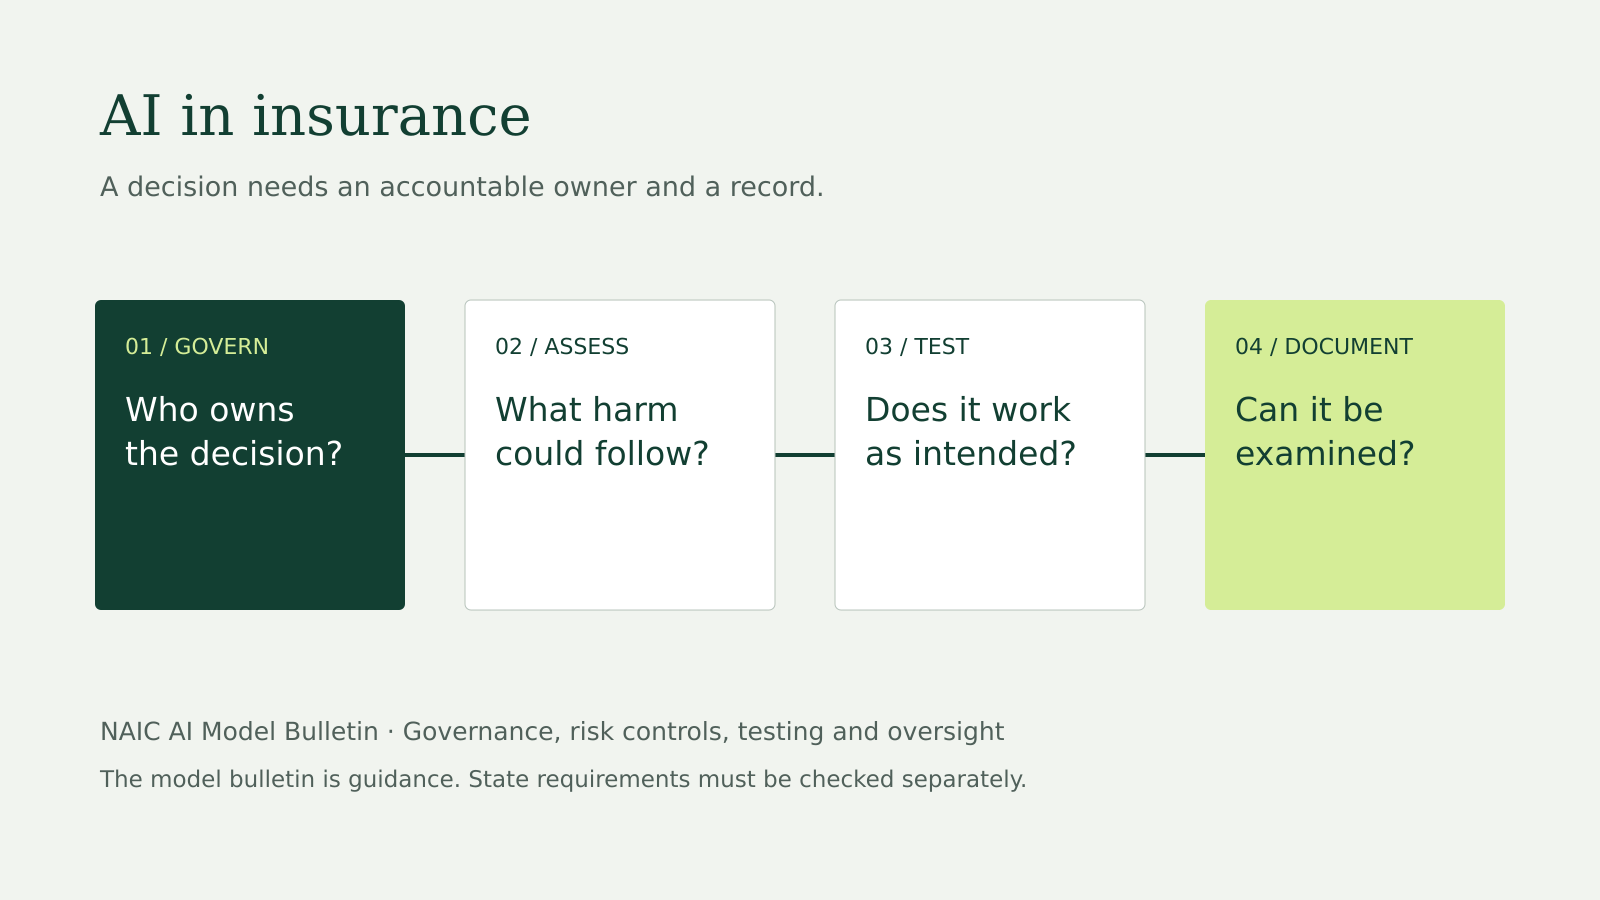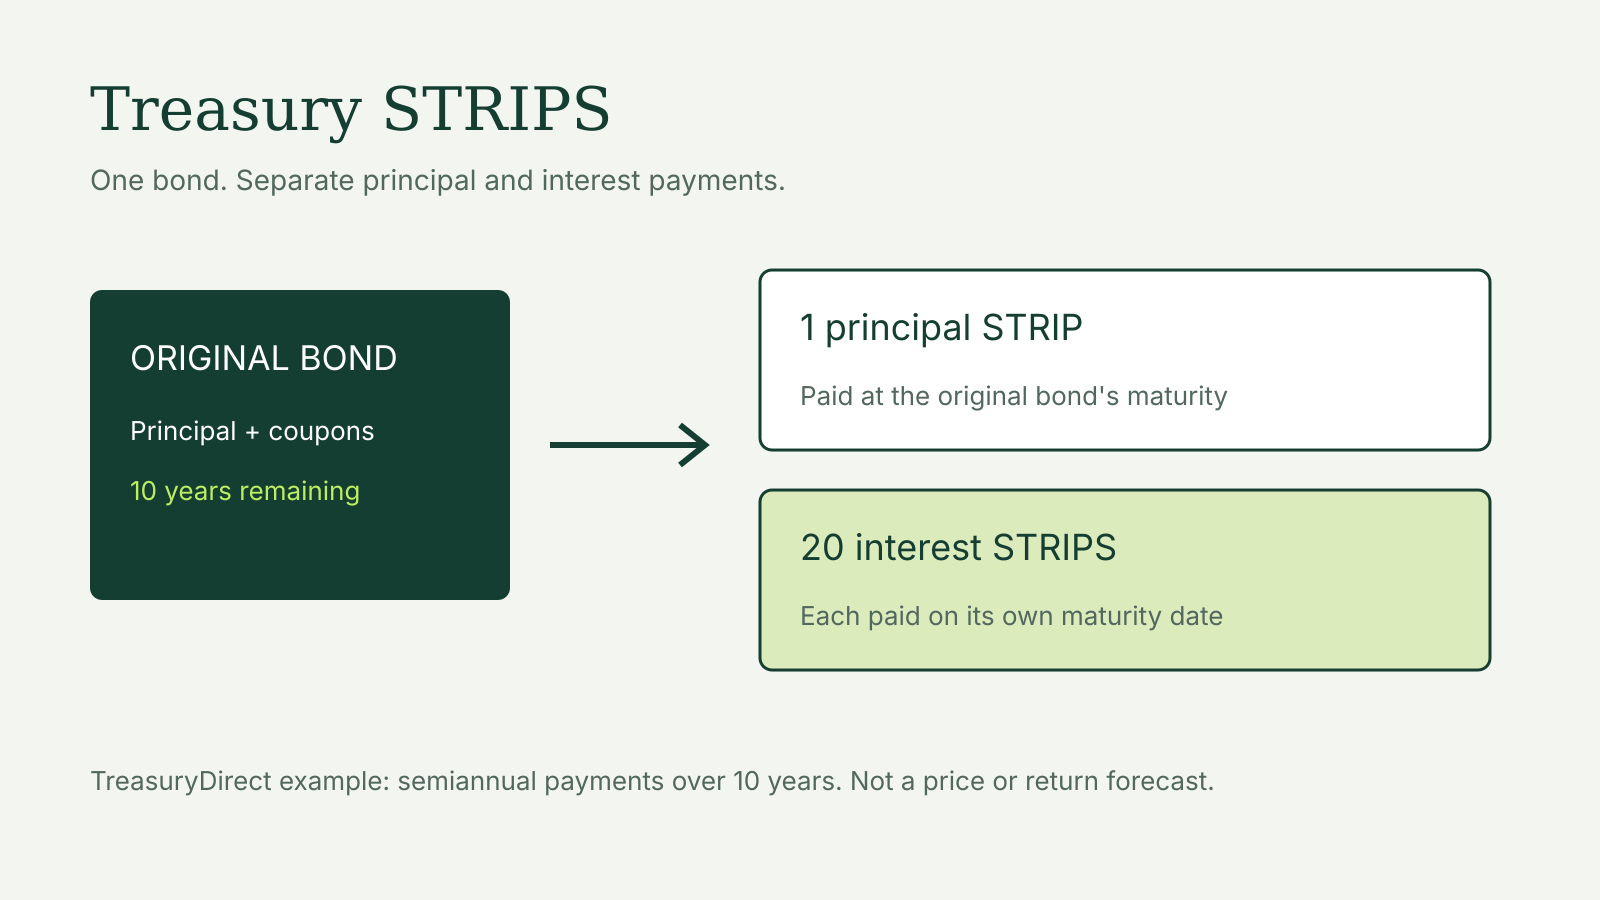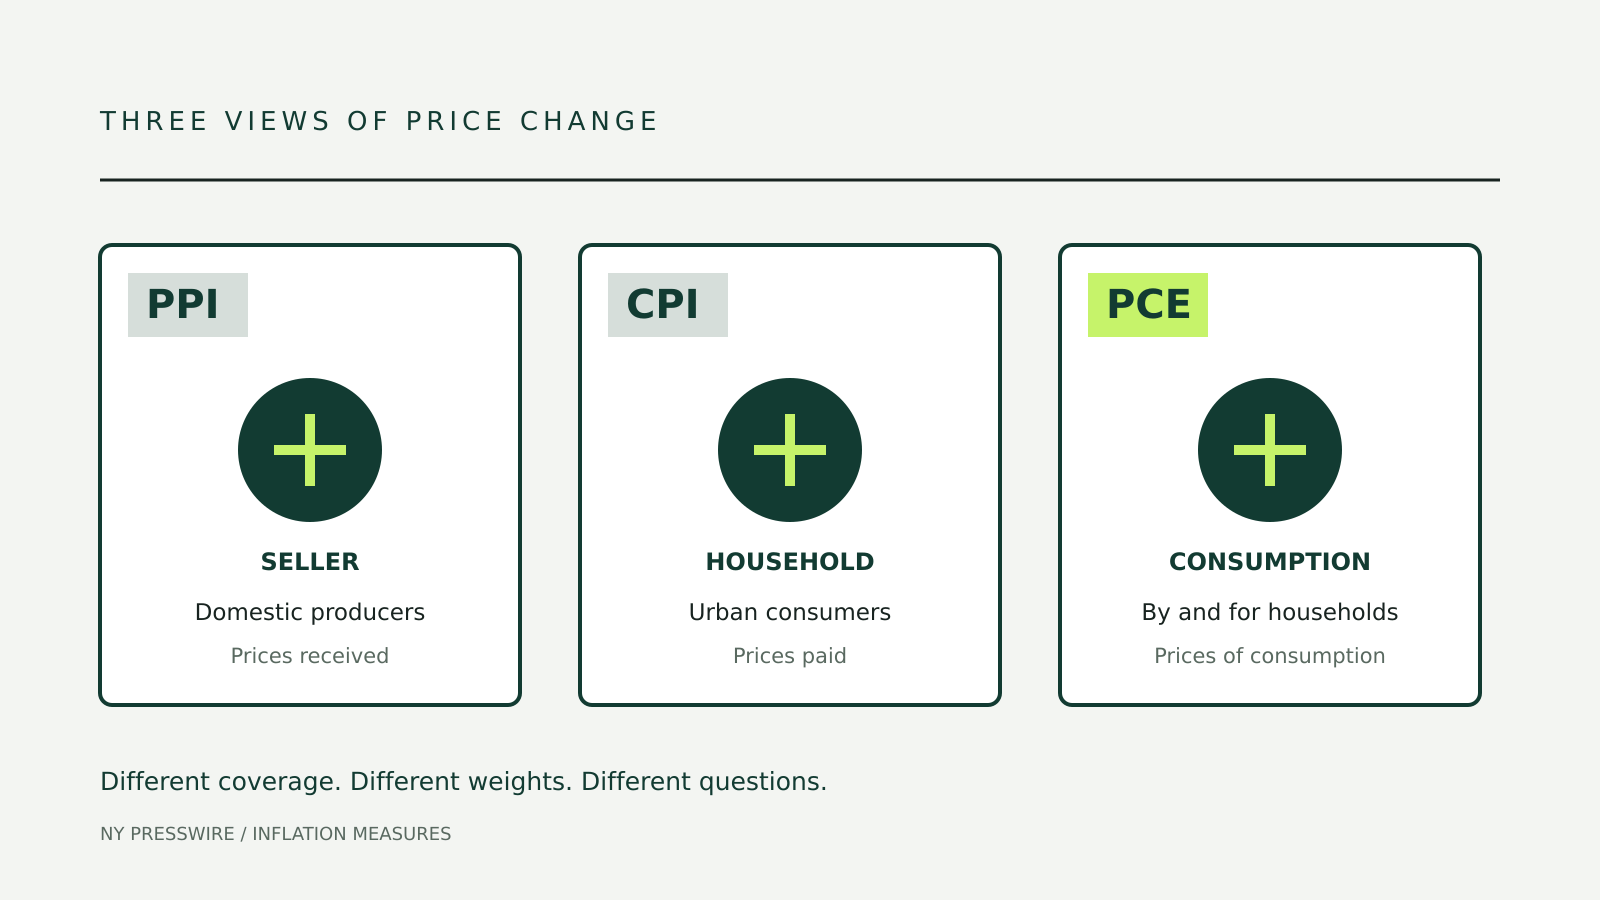
PPI vs CPI vs PCE is a comparison of three different questions. The Producer Price Index measures prices received by domestic producers. The Consumer Price Index follows prices paid by urban consumers. The Personal Consumption Expenditures price index measures price changes across a broader set of spending by and on behalf of households.
They can move in different directions without any of them being wrong. Their coverage, weights and calculation methods differ. Reading them as interchangeable inflation scores hides the useful information in each release.
PPI, CPI and PCE at a glance
| Measure | Publisher | Main perspective | What makes it different |
|---|---|---|---|
| PPI | Bureau of Labor Statistics | Prices received by domestic producers | Covers goods, services and construction; final demand includes more than household consumption |
| CPI | Bureau of Labor Statistics | Prices paid by urban consumers | Focuses on household purchases and uses consumer expenditure weights |
| PCE price index | Bureau of Economic Analysis | Prices of consumption by and on behalf of the personal sector | Broader payer coverage and a chain-type formula |
A headline about producer prices is therefore not a report about the same basket as a headline about consumer prices. Even CPI and PCE, the two consumer-facing measures, do not cover exactly the same spending.
PPI starts with the seller
BLS describes PPI as a family of indexes tracking changes in selling prices received by domestic producers. The word received matters. A producer’s selling price can differ from the price a household pays because distribution costs, taxes and subsidies can sit between the two.
PPI is also broader than factory goods. It includes services and construction, and its final-demand system covers purchases by consumers, businesses, governments and foreign buyers. Intermediate-demand indexes look at products bought for further production or processing.
That makes PPI useful for following a particular industry’s selling prices or a business’s cost environment. A manufacturer might use a relevant index in a contract adjustment. An analyst might examine which inputs or services explain a broad producer-price movement.
The headline final-demand PPI is not a household shopping basket. It should not be read as a direct estimate of what a family’s groceries, rent and healthcare cost that month.
CPI starts with the consumer’s purchase
CPI measures changes in prices paid for a representative basket of consumer goods and services. The commonly reported broad measure is CPI-U, the index for all urban consumers.
Its categories include food, housing, transport, medical care and other day-to-day consumption. Sales and excise taxes directly attached to purchases are included. Income taxes and investment assets are not part of that consumption basket.
BLS stresses that a national average does not reproduce any one household’s inflation experience. Someone spending a large share of their income on rent will experience a different budget pressure from an owner with a fixed mortgage. A household with substantial medical bills can differ from one with few such expenses.
CPI is therefore a measure of average price change for its reference population. It is not a personalized cost-of-living statement, and it does not measure every factor affecting living standards.
Our guide to how CPI is calculated explains the basket and weighting process in more detail.
PCE includes spending made on people’s behalf
The PCE price index is produced by BEA as part of the national accounts. BEA’s comparison with CPI groups their differences into formula, weight, scope and other effects.
Scope is especially useful for readers. CPI focuses on households’ out-of-pocket spending. PCE includes spending by and on behalf of the personal sector, which includes households and nonprofit institutions serving them.
Healthcare illustrates why that changes the picture. A household can receive a service without paying its entire cost directly. A measure that includes payments made on the household’s behalf will give that activity a different place in its basket from a measure centered on household purchases.
This does not mean PCE is simply CPI plus healthcare. The scope of many components differs, and those differences interact with the weights and formulas. Our separate PCE vs CPI explainer follows the consumer-measure comparison.
Weights change the contribution of a price rise
An index needs more than a list of prices. It also needs a rule for how much each item matters.
If two measures include the same product but assign it different weights, a price increase can make a different contribution to each total. BEA calls that the weight effect in its CPI-PCE reconciliation.
A price series can therefore move similarly inside both systems while the headline measures diverge. Before concluding that an agency has measured the price differently, check whether the spending category has the same importance in both indexes.
PPI adds another distinction: its weights describe producer output and transactions rather than the household expenditure pattern behind CPI. There is no reason to expect those economic structures to match.
The formula matters too
BEA identifies PCE’s Fisher-Ideal formula and CPI’s modified Laspeyres formula as another source of difference. The formulas combine price and expenditure information differently.
The practical point is that spending patterns can change when relative prices change. A chain-type measure can reflect changes in the composition of spending differently from an index constructed around another weighting approach.
Avoid the shortcut that CPI assumes consumers never substitute anything. BLS uses geometric means for most basic CPI indexes, allowing a degree of substitution within item categories. The separately published chained CPI also allows substitution across categories.
“CPI” and “chained CPI” are not interchangeable labels. Check the exact series before comparing either with PCE.
A producer-price rise is not a retail-price forecast
PPI can show pressure earlier in a production chain, but it does not provide a fixed timetable for consumer inflation.
A business may absorb a higher input cost in its margin, switch suppliers, change its product mix or renegotiate a contract. Retail demand and competition can affect how much it passes through. A broad PPI movement can also come from categories that do not map neatly to household purchases.
For the same reason, falling producer prices do not mean every household bill must fall next month. The coverage and timing differ, and services can behave differently from goods.
Use PPI to identify the producer-side change, then examine the relevant consumer component. Treat a claim about future retail prices as an additional argument that needs evidence.
Compare the same kind of change
Before putting any two inflation figures side by side, check:
- Period: monthly change, 12-month change or an annualized rate?
- Adjustment: seasonally adjusted or unadjusted?
- Coverage: all items, a core measure or a selected component?
- Series: CPI-U, chained CPI, final-demand PPI or another index?
- Vintage: is the release preliminary, revised or from a later historical update?
A monthly increase and a 12-month increase answer different questions. So do an index level and its percentage change. Mixing those labels can create an apparent contradiction that comes entirely from the comparison.
For publication dates, use the US economic calendar. For interpretation, start with the exact release and its component tables rather than a headline alone.